如何在 Matplotlib 中指定图形坐标中的图例位置
Suraj Joshi
2024年2月15日
Matplotlib
Matplotlib Legend

我们可以通过设置 loc 参数的值来指定图例在图形中的位置。
示例:Matplotlib 在图形坐标中指定图例位置
import matplotlib.pyplot as plt

x = [1, 2, 3]
y1 = [0.5 * i + 1 for i in x]
y2 = [2 * i + 1 for i in x]

fig, ax = plt.subplots(2, 1)

ax[0].plot(x, y1, "b-", label="0.5x+1")
ax[0].plot(x, y2, "g-", label="2x+1")
ax[0].legend(loc="best")

ax[1].plot(x, y1, "b-", label="0.5x+1")
ax[1].plot(x, y2, "g-", label="2x+1")
ax[1].legend(loc="lower left")

plt.tight_layout()
plt.show()
输出:
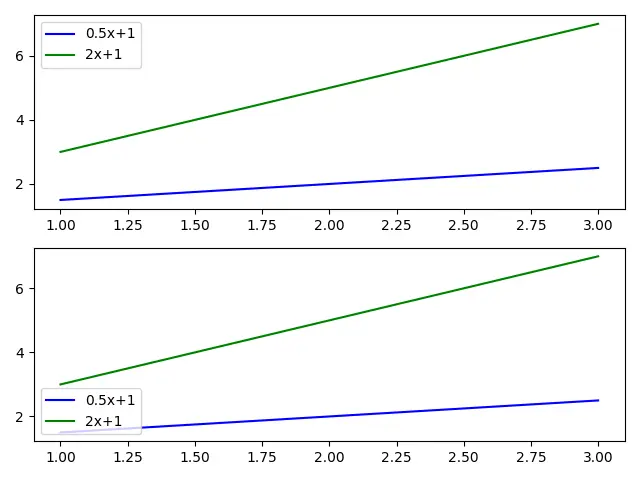
这里,我们有一个有两个子图的图。最上面的子图将 loc 设置为 best;这就将图例放置在图的最佳位置,在此处我们没有任何内容。
类似的情况也发生在底部的第二个子图中:图例被放置在边界框的左下角位置,覆盖了整个轴线。边界框由 bbox_to_anchor 参数指定,其默认值为 (0,0,1,1)。
loc 参数可以取以下任意一个值。
best |
upper right |
upper left |
lower left |
lower right |
right |
center left |
center right |
lower center |
upper center |
center |
这些位置代表图例相对于 bbox_to_anchor 参数指定的边界框的位置。
同样,我们可以通过改变 bbox_to_anchor 参数的值将图例放置在图中的任何位置。bbox_to_anchor 参数取一个元组,代表坐标,loc 参数指定的角将被放置在那里。
import matplotlib.pyplot as plt

x = [1, 2, 3]
y1 = [0.5 * i + 1 for i in x]
y2 = [2 * i + 1 for i in x]

fig, ax = plt.subplots(2, 1)

ax[0].plot(x, y1, "b-", label="Plot-1")
ax[0].plot(x, y2, "g-", label="Plot-2")
ax[0].legend(loc="upper left", bbox_to_anchor=(0.9, 0.75))
ax[0].scatter((0.9), (0.75), s=70, c="red", transform=ax[0].transAxes)

ax[1].plot(x, y1, "b-", label="Plot-1")
ax[1].plot(x, y2, "g-", label="Plot-2")
ax[1].legend(loc="center right", bbox_to_anchor=(0.6, 0.4))
ax[1].scatter((0.6), (0.4), s=70, c="red", transform=ax[1].transAxes)

plt.tight_layout()
plt.show()
输出:
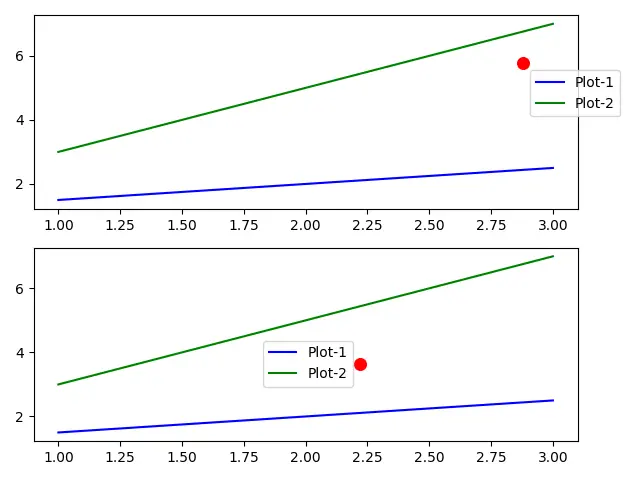
在顶部的子图中,我们将 bbox_to_anchor 设置为 (0.9,0.75),由子图上的红点标示。loc 参数"upper left"的值表示图例的左上角,放在红点处。
底部的子图,bbox_to_anchor 设置为 (0.6,0.4),由图中底轴的红点标示。loc 的值设置为"center right";因此,底轴图例的右边中心在红点处。
Enjoying our tutorials? Subscribe to DelftStack on YouTube to support us in creating more high-quality video guides. Subscribe
作者: Suraj Joshi

Suraj Joshi is a backend software engineer at Matrice.ai.
LinkedIn