Pandas DataFrame DataFrame.plot.hist() Function
-
Syntax of
pandas.DataFrame.plot.hist() -
Example Codes:
DataFrame.plot.hist() -
Example Codes:
DataFrame.plot.hist()to Draw a Complex Histogram -
Example Codes:
DataFrame.plot.hist()to Change the Number of Bins
Python Pandas DataFrame.plot.hist() function draws a single histogram of the columns of a DataFrame. A histogram represents the data in the graphical form. It creates bars of ranges. The taller bar shows that more data falls into the range of this bar.
Syntax of pandas.DataFrame.plot.hist()
DataFrame.sample(by=None, bins=10, **kwargs)
Parameters
by |
It is a string or a sequence. It represents the columns of the DataFrame to group by. |
bins |
It is an integer. It represents the number of histogram bins. A bin is like a range, for example, 0-5, 6-10, etc. |
**kwargs |
These are the additional keyword arguments to customize the histogram. You can check these here. |
Return
It returns a plotted histogram and AxesSubplot data.
Example Codes: DataFrame.plot.hist()
Let’s first plot a histogram using a simple DataFrame.
import pandas as pd
dataframe = pd.DataFrame({'Value':[100, 200, 300]})
print(dataframe)
Our DataFrame is as below.
 Value
0  100
1  200
2  300
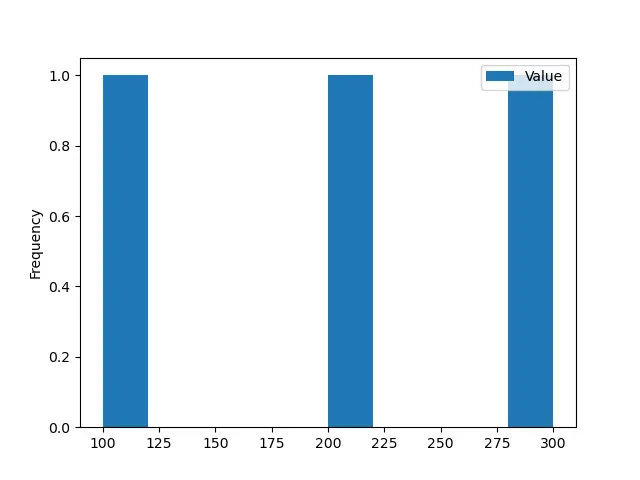
All the parameters of this function are optional. If we execute this function without passing any parameter then it produces the following output.
import pandas as pd
from matplotlib import pyplot as plt

dataframe = pd.DataFrame({'Value':[100, 200, 300]})

histogram = dataframe.plot.hist()
print(histogram)
plt.show()
Output:
AxesSubplot(0.125,0.125;0.775x0.755)
Example Codes: DataFrame.plot.hist() to Draw a Complex Histogram
Now, we will convert our DataFrame to a complex one.
import pandas as pd
import numpy as np

dataframe = pd.DataFrame(np.random.randint(0, 200, size=(200, 3)), columns=list("ABC"))

print(dataframe)
Our DataFrame becomes,
 A    B    C
0     15  163  163
1     29    7   54
2    195   40    6
3    183   92   57
4     72  167   40
..   ...  ...  ...
195   79   35    7
196  122   79  142
197  121   46  124
198  138  141  114
199  148   95  129

[200 rows x 3 columns]
We have used NumPy.random.randint() function to create a DataFrame that contains random integers. Now, we will draw the histogram of this DataFrame using DataFrame.plot.hist() function.
import pandas as pd
import numpy as np

from matplotlib import pyplot as plt

dataframe = pd.DataFrame(np.random.randint(0, 200, size=(200, 3)), columns=list("ABC"))

histogram = dataframe.plot.hist()
print(histogram)
plt.show()
Output:
AxesSubplot(0.125,0.125;0.775x0.755)
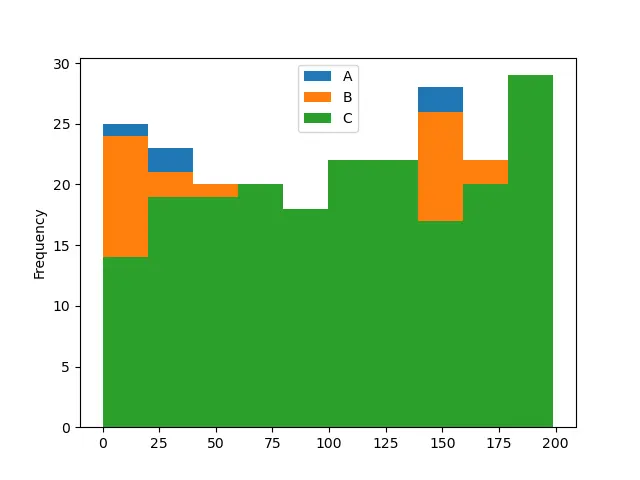
The function has drawn a histogram that has 10 bins by default. It shows the frequency distribution of three columns of the DataFrame. Each column is represented by a specific color.
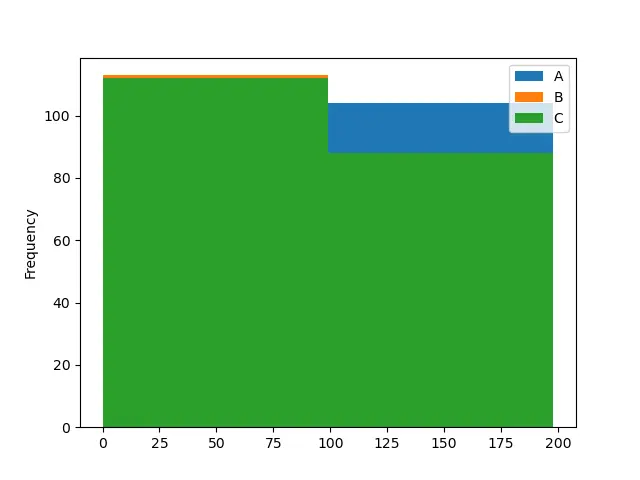
Example Codes: DataFrame.plot.hist() to Change the Number of Bins
import pandas as pd
import numpy as np
from matplotlib import pyplot as plt

dataframe = pd.DataFrame(np.random.randint(0, 200, size=(200, 3)), columns=list("ABC"))

histogram = dataframe.plot.hist(bins=2)
print(histogram)
plt.show()
Output:
AxesSubplot(0.125,0.125;0.775x0.755)
import pandas as pd
import numpy as np
from matplotlib import pyplot as plt
dataframe = pd.DataFrame(np.random.randint(0, 200, size=(200, 3)), columns=list("ABC"))
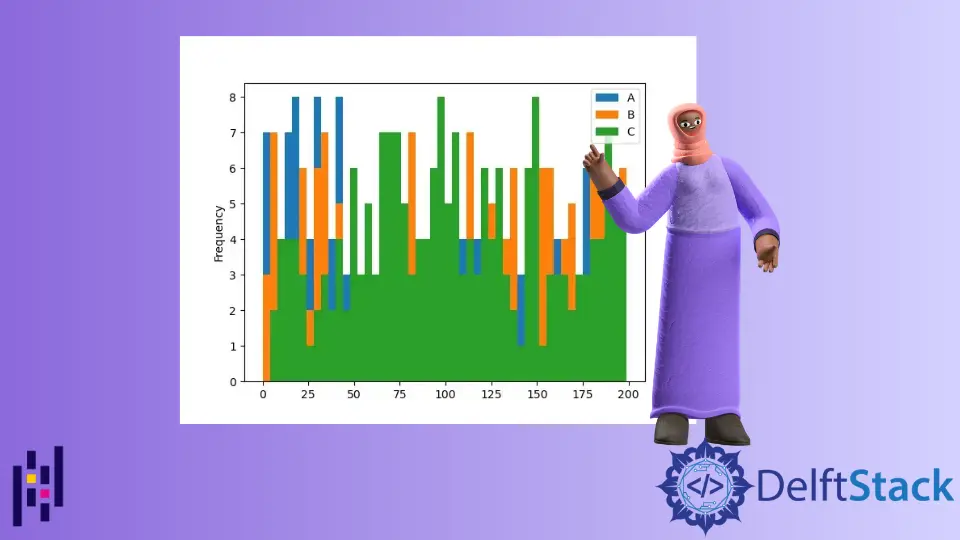
histogram = dataframe.plot.hist(bins=50)
print(histogram)
plt.show()
Output:
AxesSubplot(0.125,0.125;0.775x0.755)
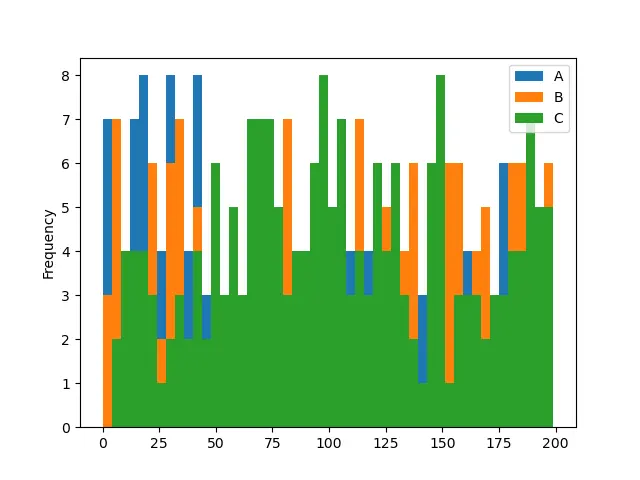
In the first example code, we have changed the number of bins to 2 and in the second example code, it is 50. Note that the greater the number of bins the easier it is to understand the histogram. The first histogram is ambiguous as we are not able to see the column A bars.
Related Article - Pandas DataFrame
- Pandas concat Function
- Pandas cut Function
- Pandas DataFrame sort_index() Function
- Pandas DataFrame.idxmax() Function
- Pandas DataFrame.insert() Function
- Pandas DataFrame.resample() Function