Pandas DataFrame DataFrame.plot.bar() Function
-
Syntax of
pandas.DataFrame.plot.bar() -
Example Codes:
DataFrame.plot.bar() -
Example Codes:
DataFrame.plot.bar()With Multiple Data Columns -
Example Codes:
DataFrame.plot.bar()Withsubplots=Trueto Create Subplots -
Example Codes:
DataFrame.plot.bar()to Plot Single Data Column -
Example Codes:
DataFrame.plot.bar()With the Specified Colors

Python Pandas DataFrame.plot.bar() function plots a bar graph along the specified axis. It plots the graph in categories. The categories are given on the x-axis and the values are given on the y-axis.
Syntax of pandas.DataFrame.plot.bar()
DataFrame.sample(x=None, y=None, **kwds)
Parameters
x |
This is the axis where categories will be plotted. If it is not specified, then the index of the DataFrame is used. |
y |
It represents the values that are plotted against the categories. If it is not specified, then it plots all the numerical columns of the DataFrame against the categories. |
**kwds |
These are the additional keyword arguments to customize the plotted graph. You can check these here. |
Return
It returns a N-dimensional array. If subplots=True, then it returns N-dimensional array with matplotlib.axes.Axes per column.
Example Codes: DataFrame.plot.bar()
Let’s first understand this function using a simple DataFrame.
import pandas as pd
dataframe = pd.DataFrame({'Value':[100, 200, 300]})
print(dataframe)
Our DataFrame is as below.
 Value
0  100
1  200
2  300
All the parameters of this function are optional. If we execute this function without passing any parameter then it takes the index as x-axis and numeric data columns as y-axis.
import pandas as pd
import matplotlib.pyplot as plt

dataframe = pd.DataFrame({"Value": [100, 200, 300]})
axis = dataframe.plot.bar(rot=0)
print(axis)
plt.show()
Output:
AxesSubplot(0.125,0.125;0.775x0.755)
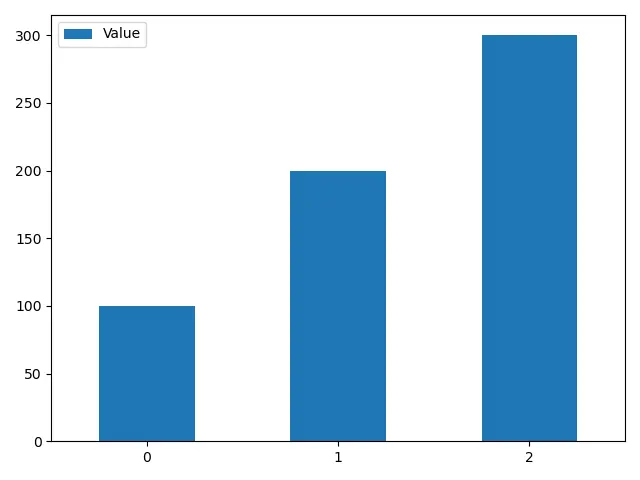
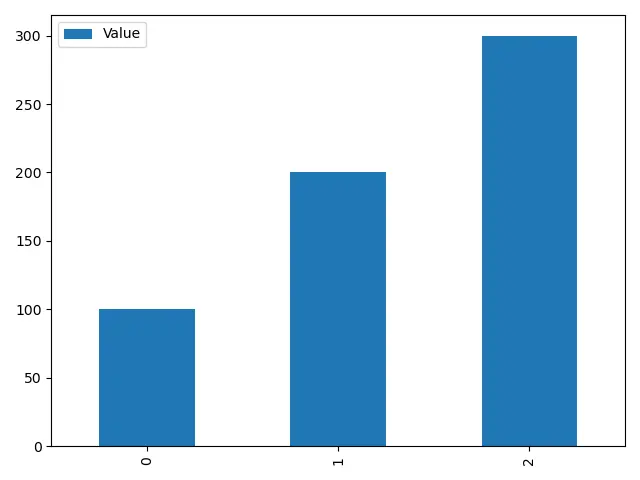
The parameter rot is an additional keyword parameter. It changes the rotation of the categories names on the x-axis.
The plot will look like below if we don’t set rot.
Example Codes: DataFrame.plot.bar() With Multiple Data Columns
Now, we will change our DataFrame to a complex one.
import pandas as pd

dataframe = pd.DataFrame(
    {
        "Age": [23, 17, 40, 38, 24, 12, 45],
        "Avg Age in Family": [70, 65, 80, 55, 60, 63, 90],
    },
    index=["Olivia", "John", "Laura", "Ben", "Kevin", "Robin", "Elsa"],
)
print(dataframe)
Our DataFrame looks like
        Age  Avg Age in Family
Olivia   23                 70
John     17                 65
Laura    40                 80
Ben      38                 55
Kevin    24                 60
Robin    12                 63
Elsa     45                 90
Plot this DataFrame using DataFrame.plot.bar() function
import pandas as pd
import matplotlib.pyplot as plt

dataframe = pd.DataFrame(
    {
        "Age": [23, 17, 40, 38, 24, 12, 45],
        "Avg Age in Family": [70, 65, 80, 55, 60, 63, 90],
    },
    index=["Olivia", "John", "Laura", "Ben", "Kevin", "Robin", "Elsa"],
)
axis = dataframe.plot.bar(rot=0)
print(axis)
plt.show()
Output:
AxesSubplot(0.125,0.125;0.775x0.755)
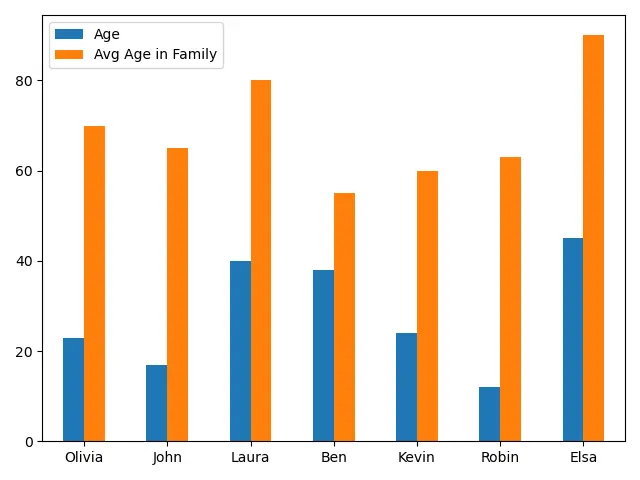
It generates a bar graph containing two bars of numerical data of each category. It helps in analyzing data efficiently.
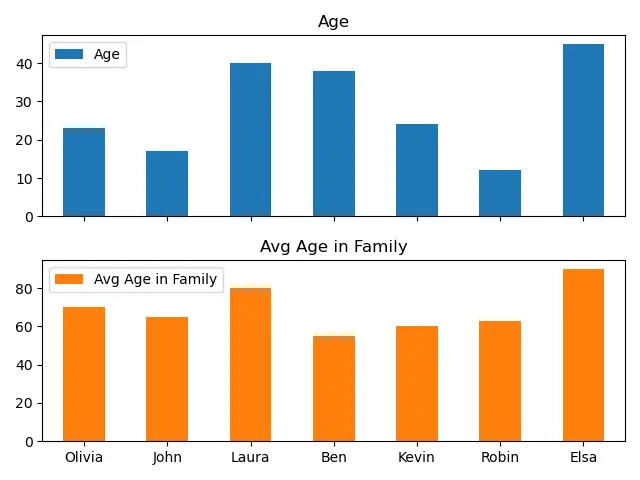
Example Codes: DataFrame.plot.bar() With subplots=True to Create Subplots
If subplots=True, then the function returns an N-dimensional array with matplotlib.axes.Axes per column. Using this, we can separate our data columns into different subplots instead of one single plot.
import pandas as pd
import matplotlib.pyplot as plt

dataframe = pd.DataFrame(
    {
        "Age": [23, 17, 40, 38, 24, 12, 45],
        "Avg Age in Family": [70, 65, 80, 55, 60, 63, 90],
    },
    index=["Olivia", "John", "Laura", "Ben", "Kevin", "Robin", "Elsa"],
)
axes = dataframe.plot.bar(rot=0, subplots=True)
print(axes)
plt.show()
Output:
[<matplotlib.axes._subplots.AxesSubplot object at 0x0000029A89B06DC8>
 <matplotlib.axes._subplots.AxesSubplot object at 0x0000029A89B4B2C8>]
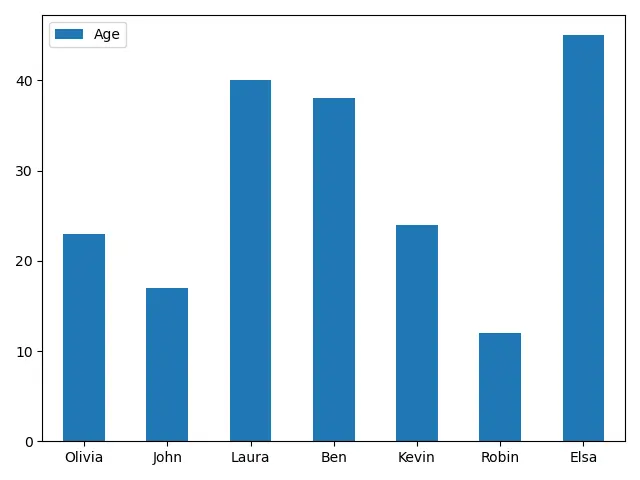
Example Codes: DataFrame.plot.bar() to Plot Single Data Column
import pandas as pd
import matplotlib.pyplot as plt

dataframe = pd.DataFrame(
    {
        "Age": [23, 17, 40, 38, 24, 12, 45],
        "Avg Age in Family": [70, 65, 80, 55, 60, 63, 90],
    },
    index=["Olivia", "John", "Laura", "Ben", "Kevin", "Robin", "Elsa"],
)
axis = dataframe.plot.bar(y="Age", rot=0)
print(axis)
plt.show()
Output:
AxesSubplot(0.125,0.125;0.775x0.755)
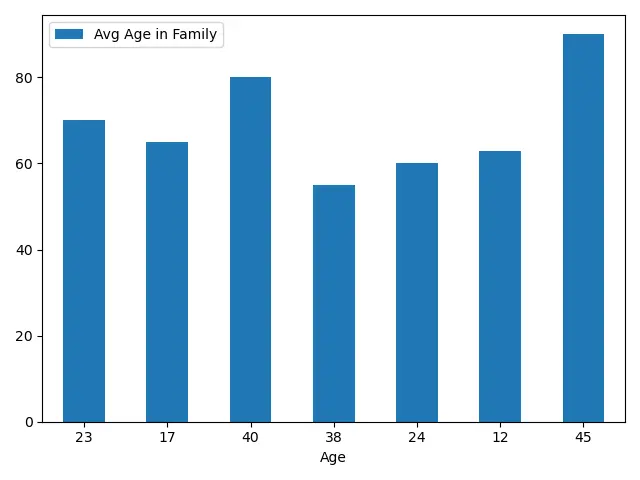
We can also plot any data column against other columns instead of plotting indexes as categories.
import pandas as pd
import matplotlib.pyplot as plt

dataframe = pd.DataFrame(
    {
        "Age": [23, 17, 40, 38, 24, 12, 45],
        "Avg Age in Family": [70, 65, 80, 55, 60, 63, 90],
    },
    index=["Olivia", "John", "Laura", "Ben", "Kevin", "Robin", "Elsa"],
)
axis = dataframe.plot.bar(x="Age", rot=0)
print(axis)
plt.show()
Output:
AxesSubplot(0.125,0.125;0.775x0.755)
Example Codes: DataFrame.plot.bar() With the Specified Colors
import pandas as pd
import matplotlib.pyplot as plt

dataframe = pd.DataFrame(
    {
        "Age": [23, 17, 40, 38, 24, 12, 45],
        "Avg Age in Family": [70, 65, 80, 55, 60, 63, 90],
    },
    index=["Olivia", "John", "Laura", "Ben", "Kevin", "Robin", "Elsa"],
)
axis = dataframe.plot.bar(rot=0, color="m")
plt.show()
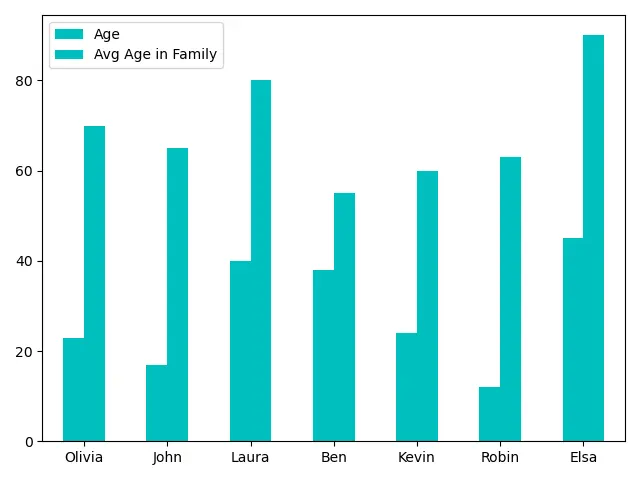
It specifies the color m for all columns in the DataFrame.
import pandas as pd
import matplotlib.pyplot as plt

dataframe = pd.DataFrame(
    {
        "Age": [23, 17, 40, 38, 24, 12, 45],
        "Avg Age in Family": [70, 65, 80, 55, 60, 63, 90],
    },
    index=["Olivia", "John", "Laura", "Ben", "Kevin", "Robin", "Elsa"],
)
axis = dataframe.plot.bar(rot=0, color=["r", "b"])
print(axis)
plt.show()
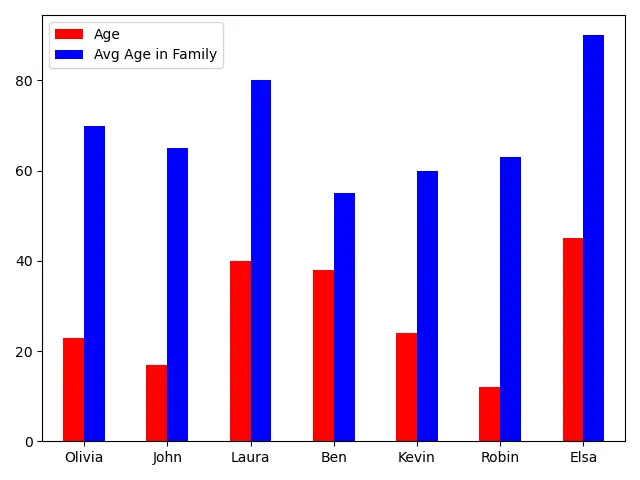
We could also specify different colors for different columns in the DataFrame by giving a color list to the color parameter.
Related Article - Pandas DataFrame
- Pandas concat Function
- Pandas cut Function
- Pandas DataFrame sort_index() Function
- Pandas DataFrame.idxmax() Function
- Pandas DataFrame.insert() Function
- Pandas DataFrame.resample() Function