How to Create Histogram With ggplot in R
-
Use
geom_histogramto Create a Histogram Withggplotin R -
Use
fill,colourandsizeParameters to Modify the Histogram Visuals in R -
Use
facet_wrapto Construct Multiple Histograms Grouped by Category in R
This article will demonstrate how to create a histogram with ggplot in R.
Use geom_histogram to Create a Histogram With ggplot in R
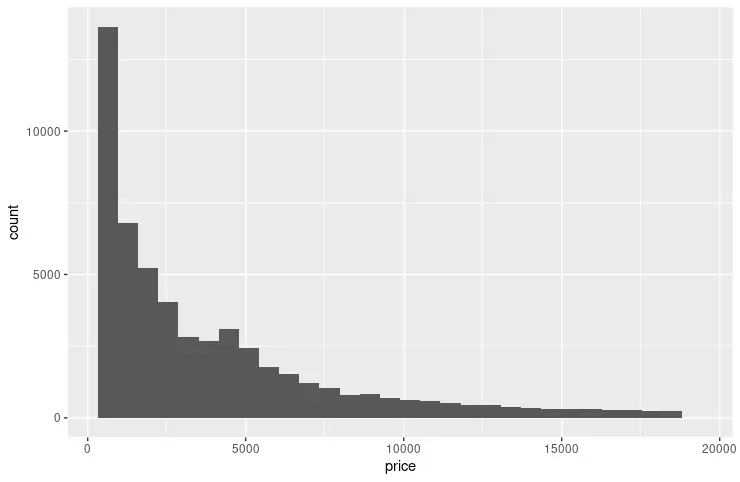
A simple histogram is constructed using the geom_histogram function, and it only needs one variable to draw the graph. In this case, we use the diamonds data set, namely, the price column from it, to specify the mapping to the x-axis. geom_histogram automatically chooses the bin size and scale data points unless explicitly passed by the user.
library(ggplot2)

p1 <- ggplot(diamonds, aes(x = price)) +
  geom_histogram()

p1
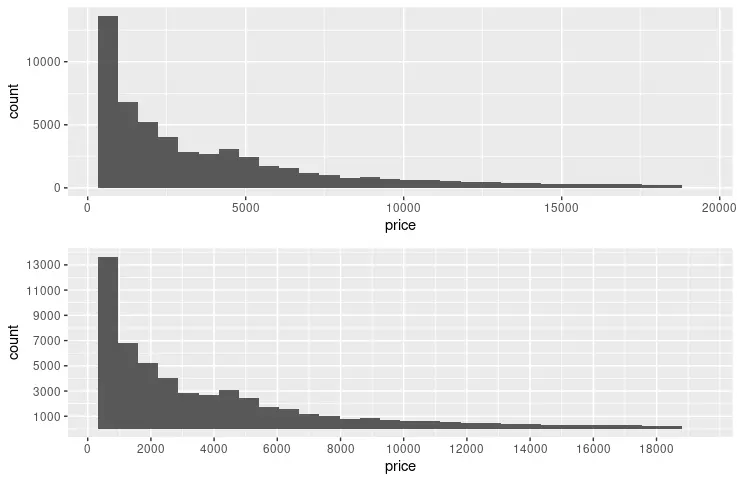
The following example expands the previous code snippet to specify the breakpoints on each axis using scale_x_continuous and scale_y_continuous functions. breaks parameter is utilized to pass the values generated by seq function. seq parameters are intuitive to read as they form the pattern - (from, to, by). We also utilize the grid.arrange function to display two graphs side-by-side for visual comparison.
library(ggplot2)
library(gridExtra)

p1 <- ggplot(diamonds, aes(x = price)) +
  geom_histogram()

p2 <- ggplot(diamonds, aes(x = price)) +
  geom_histogram() +
  scale_y_continuous(breaks = seq(1000, 14000, 2000)) +
  scale_x_continuous(breaks = seq(0, 18000, 2000))

grid.arrange(p1, p2, nrow = 2)
Use fill, colour and size Parameters to Modify the Histogram Visuals in R
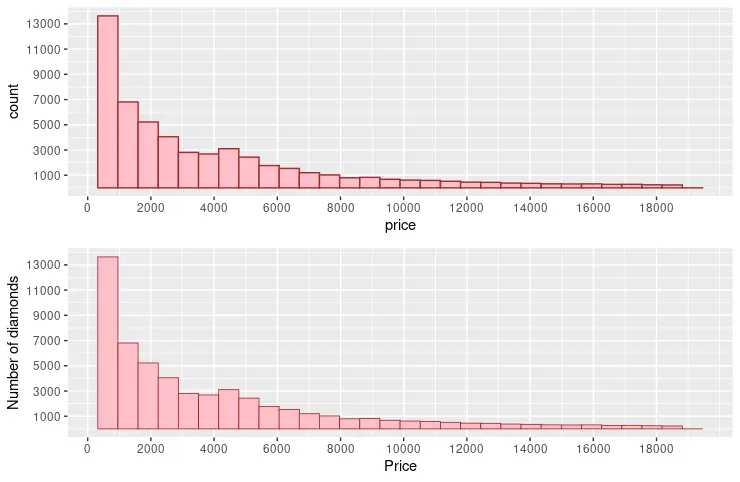
The common parameters such as fill, colour and size can be utilized to change the visual of graph bins. The fill parameter specifies the color by which bins are filled; in contrast, colour is used for the bin strokes. size takes numeric value to denote the width of the bin strokes. Notice also that the following code snippet adds the name parameter to both axes.
library(ggplot2)
library(gridExtra)

p3 <- ggplot(diamonds, aes(x = price)) +
  geom_histogram(fill = "pink", colour = "brown") +
  scale_y_continuous(breaks = seq(1000, 14000, 2000)) +
  scale_x_continuous(breaks = seq(0, 18000, 2000))

p4 <- ggplot(diamonds, aes(x = price)) +
  geom_histogram(fill = "pink", colour = "brown", size = .3) +
  scale_y_continuous(breaks = seq(1000, 14000, 2000), name = "Number of diamonds" ) +
  scale_x_continuous(breaks = seq(0, 18000, 2000), name = "Price" )

grid.arrange(p3, p4, nrow = 2)
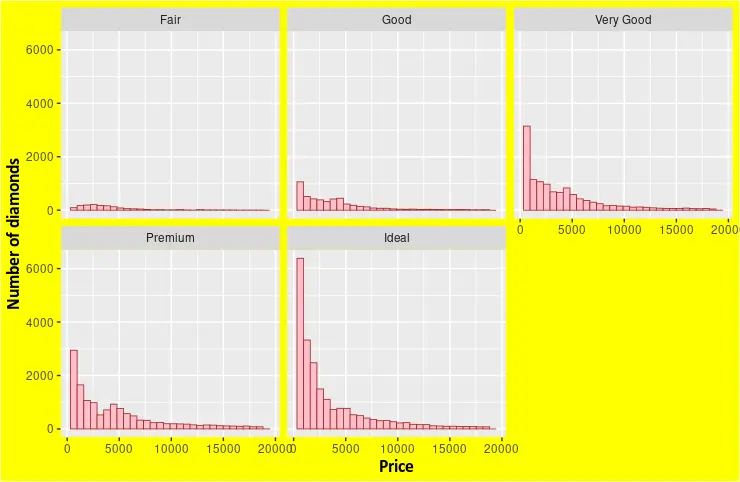
Use facet_wrap to Construct Multiple Histograms Grouped by Category in R
The facet_wrap function can be used to draw multiple histograms based on the set of variables. diamonds data set gives provides enough dimensions to choose the variables from one of its columns. E.g., we chose the cut column to display different price histograms for each type. The theme function can also be combined with the geom_histogram to specify custom formatting for graph elements.
library(ggplot2)

p5 <- ggplot(diamonds, aes(x = price)) +
  geom_histogram(fill = "pink", colour = "brown", size = .3) +
  scale_y_continuous( name = "Number of diamonds" ) +
  scale_x_continuous( name = "Price" ) +
  facet_wrap(~cut) +
  theme(
    axis.title.x = element_text(
      size = rel(1.2), lineheight = .9,
      family = "Calibri", face = "bold", colour = "black"
    ),
    axis.title.y = element_text(
      size = rel(1.2), lineheight = .9,
      family = "Calibri", face = "bold", colour = "black"
    ),
    plot.background = element_rect("yellow"))


p5

Founder of DelftStack.com. Jinku has worked in the robotics and automotive industries for over 8 years. He sharpened his coding skills when he needed to do the automatic testing, data collection from remote servers and report creation from the endurance test. He is from an electrical/electronics engineering background but has expanded his interest to embedded electronics, embedded programming and front-/back-end programming.
LinkedIn Facebook