How to Set Color for Scatterplot in Matplotlib

To set the color of markers in Matplotlib, we set the c parameter in matplotlib.pyplot.scatter() method.
Set the Color of a Marker in the Scatterplot
import matplotlib.pyplot as plt

x = [1, 2, 3, 4, 5, 6, 7]
y = [2, 1, 4, 7, 4, 3, 2]

plt.scatter(x, y, c="red")
plt.xlabel("X")
plt.ylabel("Y")
plt.title("Simple Scatter Plot")
plt.show()
Output:

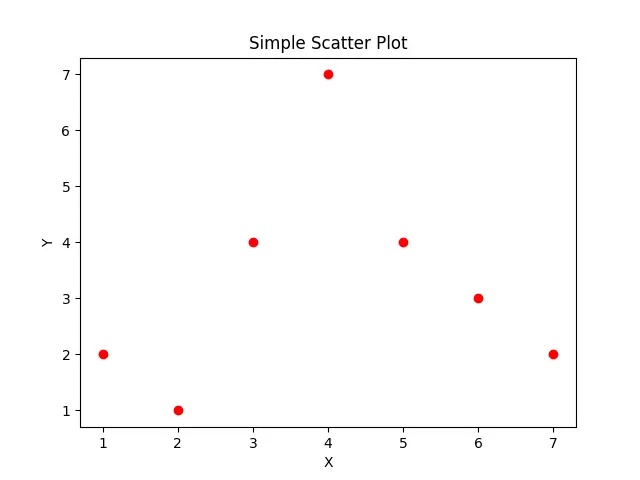
Here, we set the color of all the markers in the scatterplots to red by setting c="red" in the scatter() method.
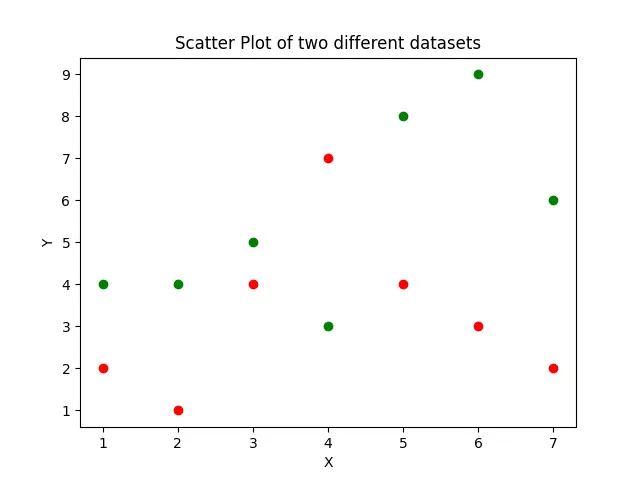
If we have two different datasets, we can use different colors for each dataset using the different values of the c parameter.
import matplotlib.pyplot as plt

x = [1, 2, 3, 4, 5, 6, 7]
y1 = [2, 1, 4, 7, 4, 3, 2]
y2 = [4, 4, 5, 3, 8, 9, 6]

plt.scatter(x, y1, c="red")
plt.scatter(x, y2, c="green")
plt.xlabel("X")
plt.ylabel("Y")
plt.title("Scatter Plot of two different datasets")
plt.show()
Output:

Here, the dataset y1 is represented in the scatter plot by the red color while the dataset y2 is represented in the scatter plot by the green color.
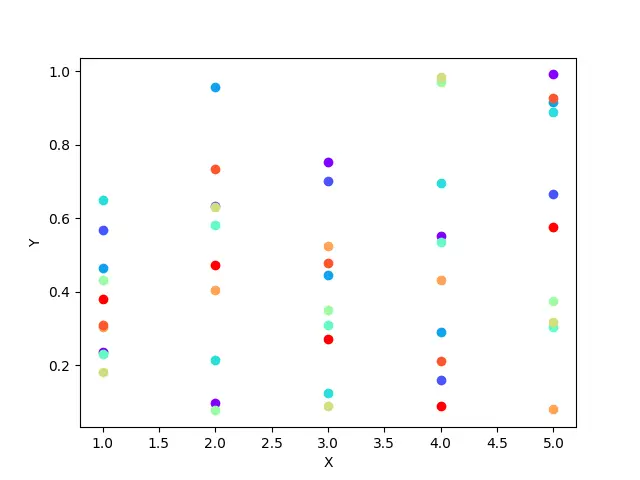
It will be difficult to assign color manually every time to each dataset if there are a huge number of datasets. In such cases, we can use colormap to generate the colors for each set of data.
import numpy as np
import matplotlib.pyplot as plt
import matplotlib.cm as cm

x = np.array([1, 2, 3, 4, 5])
y = np.random.random((10, 5))

colors = cm.rainbow(np.linspace(0, 1, y.shape[0]))
for dataset, color in zip(y, colors):
    plt.scatter(x, dataset, color=color)

plt.xlabel("X")
plt.ylabel("Y")
plt.show()
Output:

It generates different colors for each row in the matrix y and plots each row with a different color.
Instead of using the generated color map, we can also specify colors to be used for scatter plots in a list and pass the list to the itertools.cycle() method to make a custom color cycler. To iterate over the color, we use the next() function.
import itertools
import numpy as np
import matplotlib.pyplot as plt
import matplotlib.cm as cm

x = np.array([1, 2, 3, 4, 5])
y = np.random.random((10, 5))

color_cycle = itertools.cycle(
    ["orange", "pink", "blue", "brown", "red", "grey", "yellow", "green"]
)

for row in y:
    plt.scatter(x, row, color=next(color_cycle))

plt.xlabel("X")
plt.ylabel("Y")
plt.show()
Output:

The itertools.cycle() method will create a cyclic list of colors from the given set of colors, and each row is plotted in the scatter plot picking a color from the cyclic list.
Suraj Joshi is a backend software engineer at Matrice.ai.
LinkedInRelated Article - Matplotlib Scatter Plot
- How to Plot List of X,y Coordinates in Matplotlib
- How to Label Scatter Points in Matplotlib
- How to Plot Points in Matplotlib
- How to Make the Legend of the Scatter Plot in Matplotlib
