How to Custom Colormap Using Python Matplotlib
- Use Matplotlib to Create a Custom Colormap in Python
-
Use
get_cmap()Method of Matplotlib to Access Colormaps and Their Values in Python -
Use
colorsAttribute ofListedColormapObject to Create a Custom Listed Colormap in Python - How to Create Custom Linear Segmented Colormap in Python?
- Conclusion

Colormaps are one of the most effective ways to show variations among continuous and discrete values in a graph.
This article will discuss creating a custom colormap using Matplotlib in Python.
Use Matplotlib to Create a Custom Colormap in Python
The matplotlib library offers various built-in colormaps. However, suppose you want to manipulate colormaps or create custom colormaps. In that case, you can do it using the ListedColormap class or the LinearSegmentedColormap class defined in the matplotlib library.
Before creating custom colormaps, let us first discuss how we can access values in the Matplotlib colormaps to understand the implementation of the colormaps. It will make us able to create custom colormaps of our own choice.
Use get_cmap() Method of Matplotlib to Access Colormaps and Their Values in Python
There are various colormaps defined in the Matplotlib module. Each colormap has been assigned its unique name. We can access a colormap using the get_cmap() method in the cm module of the matplotlib library.
The syntax for the get_cmap() method is as follows.
matplotlib.cm.get_cmap(name=None, lut=None)
- The
nameparameter accepts the colormap’s name as a string or aColormapobject defined in thematplotlib.colorsmodule. It has a default value ofNone. If we do not specify any input for the parameter name, theget_cmap()method returns theviridiscolormap. - If a colormap with the specified name defined in the Matplotlib library, the
get_cmap()method returns aColormapinstance. - The default value for parameter
lutisNone. Iflutisn’tNone, it should be an integer that specifies the number of colors in the list used to define the colormap. - If the
nameis not a valid colormap andlutisn’tNone, the colormap is resampled to enterlutvalues in the lookup table.
import numpy as np
import matplotlib.pyplot as plt
from matplotlib import cm
from matplotlib.colors import ListedColormap, LinearSegmentedColormap

cm.get_cmap("viridis", 8)
Output:

The above code has been run in the interactive shell in the Jupyter Notebook. If you try to execute it in a different IDE, you may or may not get the above image as output.
The colormap returned by the get_cmap() method is callable. When we pass a value between 0 and 1 to the colormap object, it returns an RGBA value.
You can observe this in this example.
import numpy as np
import matplotlib.pyplot as plt
from matplotlib import cm
from matplotlib.colors import ListedColormap, LinearSegmentedColormap

viridis = cm.get_cmap("viridis", 8)
print(viridis(0.56))
Output:
(0.122312, 0.633153, 0.530398, 1.0)
Use colors Attribute of ListedColormap Object to Create a Custom Listed Colormap in Python
To create a custom ListedColormap, let us first see how colors are stored in a ListedColormap. For this, we can use the colors attribute of the ListedColormap object.
For instance, viridis is a ListedColormap. We can observe the color values using the colors attribute of the viridis colormap, as shown in the following example.
import numpy as np
import matplotlib.pyplot as plt
from matplotlib import cm
from matplotlib.colors import ListedColormap, LinearSegmentedColormap

viridis = cm.get_cmap("viridis", 8)
print(viridis.colors)
Output:
[[0.267004 0.004874 0.329415 1.      ]
 [0.275191 0.194905 0.496005 1.      ]
 [0.212395 0.359683 0.55171  1.      ]
 [0.153364 0.497    0.557724 1.      ]
 [0.122312 0.633153 0.530398 1.      ]
 [0.288921 0.758394 0.428426 1.      ]
 [0.626579 0.854645 0.223353 1.      ]
 [0.993248 0.906157 0.143936 1.      ]]
Here, you can see that the colors are stored in an array of Nx4. You can also access the specified number of rows of the ListedColormap by calling the colormap name with the required sequence as input argument, as shown below.
import numpy as np
import matplotlib.pyplot as plt
from matplotlib import cm
from matplotlib.colors import ListedColormap, LinearSegmentedColormap

viridis = cm.get_cmap("viridis", 8)
print(viridis(range(0, 8)))
Output:
[[0.267004 0.004874 0.329415 1.      ]
 [0.275191 0.194905 0.496005 1.      ]
 [0.212395 0.359683 0.55171  1.      ]
 [0.153364 0.497    0.557724 1.      ]
 [0.122312 0.633153 0.530398 1.      ]
 [0.288921 0.758394 0.428426 1.      ]
 [0.626579 0.854645 0.223353 1.      ]
 [0.993248 0.906157 0.143936 1.      ]]
As you can observe, a ListedColormap is represented using a list. So, to create a custom ListedColormap in Python, we will have to create a list that will represent the colors of the colormap.
Use Color Names to Create Custom Listed Colormap in Python
We can create a custom-listed colormap using the ListedColormap() method. The syntax of the ListedColormap() method is as follows.
matplotlib.colors.ListedColormap(colors, name="from_list", N=None)
- The parameter
colorstake an array or list of color names or numerical values representing RGBA values. - The parameter
nameis used to give a specific name to the custom colormap created. It has a default valuefrom_list. - The parameter N denotes the number of entries in the colormap. It has a default value of
None. When N has the value None, there should be one colormap entry for each color incolorslist.
To create a custom-listed colormap using the ListedColormap() method and a list of colors, you can pass names of four colors to the ListedColormap() method. It will return a Colormap object.
After that, you can use the Colormap object to plot the data, as shown below.
import numpy as np
import matplotlib.pyplot as plt
from matplotlib import cm
from matplotlib.colors import ListedColormap, LinearSegmentedColormap
import matplotlib.colors

xdata = [1, 2, 3, 4, 5, 6, 7, 8, 9, 10, 11, 12]
ydata = [x * x for x in xdata]
norm = plt.Normalize(1, 150)
cmap = ListedColormap(["darkorange", "gold", "lawngreen", "lightseagreen"])
c = np.linspace(0, 150, 12)
plt.scatter(xdata, ydata, c=c, cmap=cmap, norm=norm)
plt.colorbar()
plt.show()
Output:

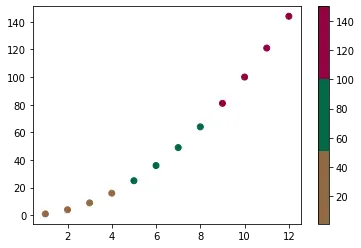
Use RGBA Values to Create Custom Listed Colormap in Python
Instead of using the color names, you can use the arrays with RGBA values to create the colormap as shown below.
import numpy as np
import matplotlib.pyplot as plt
from matplotlib import cm
from matplotlib.colors import ListedColormap, LinearSegmentedColormap
import matplotlib.colors

xdata = [1, 2, 3, 4, 5, 6, 7, 8, 9, 10, 11, 12]
ydata = [x * x for x in xdata]
norm = plt.Normalize(1, 150)
colorarray = [
    [0.57647055, 0.4116, 0.27107143, 1],
    [0, 0.4116, 0.27107143, 1],
    [0.57647055, 0, 0.27107143, 1],
]
cmap = ListedColormap(colorarray)
c = np.linspace(0, 150, 12)
plt.scatter(xdata, ydata, c=c, cmap=cmap, norm=norm)
plt.colorbar()
plt.show()
Output:
How to Create Custom Linear Segmented Colormap in Python?
Before creating custom linear segmented colormaps, let us observe how color values are stored in a linear segmented colormap.
The linear segmented colormaps do not have the color attribute. However, we can call the colormap name with the required sequence as an input argument to observe the color values.
For example, we can look at the color values of the copper colormap as follows.
import numpy as np
import matplotlib.pyplot as plt
from matplotlib import cm
from matplotlib.colors import ListedColormap, LinearSegmentedColormap

copper = cm.get_cmap("copper", 8)
print(copper(range(0, 8)))
Output:
[[0.         0.         0.         1.        ]
 [0.17647055 0.1116     0.07107143 1.        ]
 [0.35294109 0.2232     0.14214286 1.        ]
 [0.52941164 0.3348     0.21321429 1.        ]
 [0.70588219 0.4464     0.28428571 1.        ]
 [0.88235273 0.558      0.35535714 1.        ]
 [1.         0.6696     0.42642857 1.        ]
 [1.         0.7812     0.4975     1.        ]]
What Is cdict in Matplotlib in Python?
The LinearSegmentedColormap class uses anchor points between which RGBA values are interpolated to define a linear segmented colormap.
- Every anchor point is specified as a row in a matrix of the form
[x[i] yleft[i] yright[i]]. Thex[i]is the anchor, andyleft[i]andyright[i]are the color’s values on either side of the anchor point. - If the colormap has discontinuities at the anchor points, the
yleft[i]andyright[i]will have different values. Otherwise,yleft[i]andyright[i]have the same value. - The anchor points are stored in a color dictionary, often called a
cdict. The keys of the dictionary arered,green, andblue, and the corresponding values are anchor points specified as rows in a matrix of the form[x[i] yleft[i] yright[i]]. In each entry of acdict, thex[i]value must increase monotonically from 0 to 1.
You can create a color dictionary as follows.
cdict = {
    "blue": [[0.0, 0.0, 0.0], [0.5, 1.0, 1.0], [1.0, 1.0, 1.0]],
    "red": [[0.0, 0.0, 0.0], [0.25, 0.0, 0.0], [0.75, 1.0, 1.0], [1.0, 1.0, 1.0]],
    "green": [[0.0, 0.0, 0.0], [0.5, 0.0, 0.0], [1.0, 1.0, 1.0]],
}
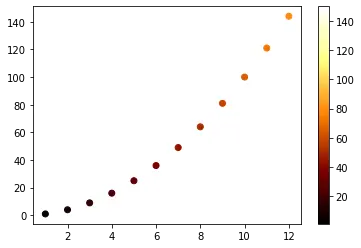
Use Anchor Points to Create Custom Linear Segmented Colormap in Python
After creating a cdict, you can use the LinearSegmentedColormap() method to create a linear segmented colormap. The syntax of the LinearSegmentedColormap() method is as follows.
matplotlib.colors.LinearSegmentedColormap(name, segmentdata, N=256, gamma=1.0)
- The
nameparameter denotes the colormap’s name. It must be a string. - The parameter
segmentdatatakes thecdictas input argument. - The parameter N denotes the number of points in the colormap lookup table. It has a default value of 256.
- The parameter
gammadenotes the scaling used for x coordinates. It has a default value of 1.0.
As shown below, we can create a linear segmented colormap using the LinearSegmentedColormap() method.
import numpy as np
import matplotlib.pyplot as plt
from matplotlib import cm
from matplotlib.colors import ListedColormap, LinearSegmentedColormap
import matplotlib.colors

xdata = [1, 2, 3, 4, 5, 6, 7, 8, 9, 10, 11, 12]
ydata = [x * x for x in xdata]
norm = plt.Normalize(1, 150)
cdict = {
    "blue": [[0.0, 0.0, 0.0], [0.5, 1.0, 1.0], [1.0, 1.0, 1.0]],
    "red": [[0.0, 0.0, 0.0], [0.25, 0.0, 0.0], [0.75, 1.0, 1.0], [1.0, 1.0, 1.0]],
    "green": [[0.0, 0.0, 0.0], [0.5, 0.0, 0.0], [1.0, 1.0, 1.0]],
}
newcmp = LinearSegmentedColormap("testCmap", segmentdata=cdict, N=256)
c = np.linspace(0, 80, 12)
plt.scatter(xdata, ydata, c=c, cmap=newcmp, norm=norm)
plt.colorbar()
plt.show()
Output:
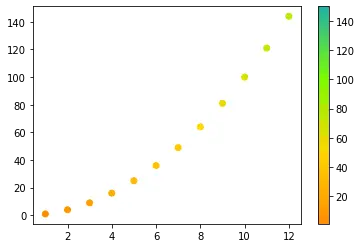
Use Color Names to Create Custom Linear Segmented Colormap in Python
Instead of using a cdict, we can also use a list of colors to create a custom colormap. For this, we can use the LinearSegmentedColormap.from_list() method. The syntax of the from_list() method is as follows.
from_list(name, colors, N=256, gamma=1.0)
Here, the parameter colors take a list of colors as the input argument. All the other parameters are similar to the LinearSegmentedColormap() method.
You can create a linear segmented colormap using the from_list() method as follows.
import numpy as np
import matplotlib.pyplot as plt
from matplotlib import cm
from matplotlib.colors import ListedColormap, LinearSegmentedColormap
import matplotlib.colors

xdata = [1, 2, 3, 4, 5, 6, 7, 8, 9, 10, 11, 12]
ydata = [x * x for x in xdata]
norm = plt.Normalize(1, 150)
colorlist = ["darkorange", "gold", "lawngreen", "lightseagreen"]
newcmp = LinearSegmentedColormap.from_list("testCmap", colors=colorlist, N=256)
c = np.linspace(0, 80, 12)
plt.scatter(xdata, ydata, c=c, cmap=newcmp, norm=norm)
plt.colorbar()
plt.show()
Output:
Conclusion
This article discussed different ways to create a custom colormap using Matplotlib in Python. We have created listed colormaps and linear segmented colormaps and plotted some data using the colormaps.

Aditya Raj is a highly skilled technical professional with a background in IT and business, holding an Integrated B.Tech (IT) and MBA (IT) from the Indian Institute of Information Technology Allahabad. With a solid foundation in data analytics, programming languages (C, Java, Python), and software environments, Aditya has excelled in various roles. He has significant experience as a Technical Content Writer for Python on multiple platforms and has interned in data analytics at Apollo Clinics. His projects demonstrate a keen interest in cutting-edge technology and problem-solving, showcasing his proficiency in areas like data mining and software development. Aditya's achievements include securing a top position in a project demonstration competition and gaining certifications in Python, SQL, and digital marketing fundamentals.
GitHub