Named Colors in Matplotlib
- Overview of the CSS Colors
- Plotting with Named Colors
- Creating a Bar Chart with Named Colors
- Customizing Colors with Named Colors
- Conclusion
- FAQ

Matplotlib is a powerful library for data visualization in Python, and one of its standout features is the ability to use named colors. Named colors allow you to add a touch of personality to your plots without needing to remember or specify RGB values.
This tutorial will guide you through the various named colors available in Matplotlib, showcasing how to use them effectively in your visualizations. Whether you’re a beginner or an experienced user, understanding named colors can enhance your plots and make your data more engaging. Let’s dive in!
Matplotlib provides a wide range of named colors that you can use directly in your plots. These colors are predefined and can be referenced by their names, making it easier to create visually appealing graphics without delving into complex color codes. Some common named colors include “red,” “blue,” “green,” and “orange.” You can find a comprehensive list of these colors in the Matplotlib documentation.
Using named colors is particularly useful when you want to quickly change the color of a plot element without worrying about the RGB or HEX values. This not only saves time but also ensures that your colors are consistent across different plots. The flexibility of named colors allows for easy customization, making your visualizations stand out.
Before coloring our plots, we need to set up our script to work with the library. Copy and paste the code below, and keep in mind that your outputs will differ.
import matplotlib.pyplot as plt
from random import randrange

data_1 = [randrange(0, 10) for _ in range(0, 10)]
data_2 = [randrange(0, 10) for _ in range(0, 10)]
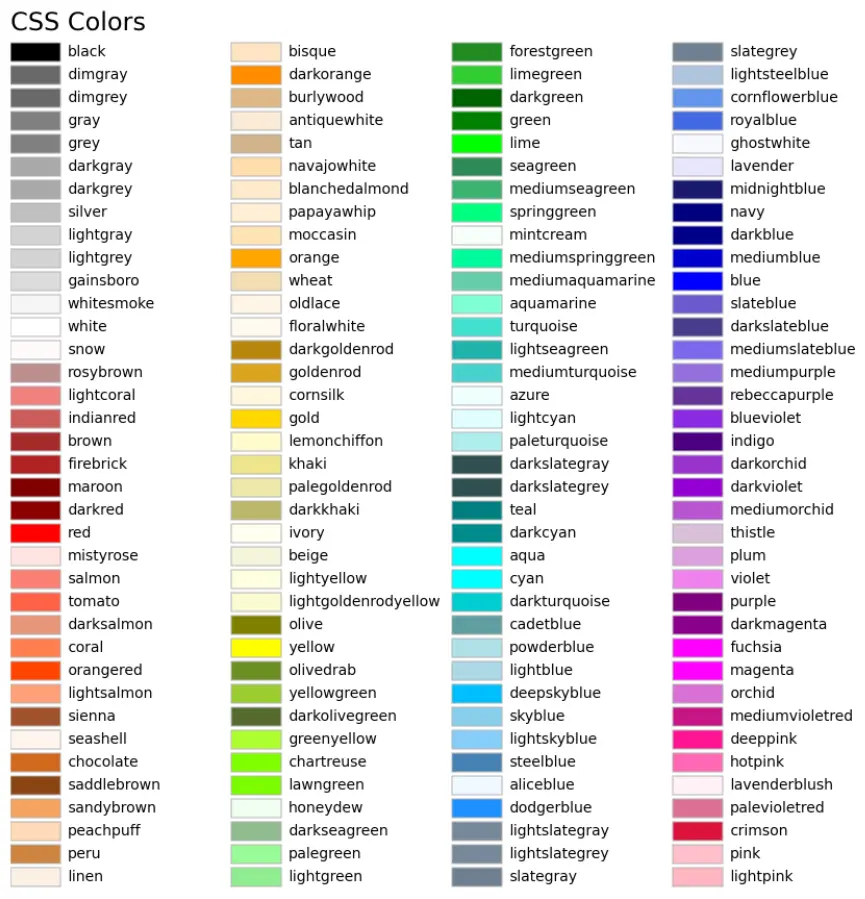
Overview of the CSS Colors
There are many ways to define the Plot color in Matplotlib, and now we will look at named colors. The following Picture shows all CSS named Colors available for usage.
Plotting with Named Colors
To demonstrate how to use named colors in Matplotlib, let’s create a simple line plot. The following code snippet illustrates how to incorporate named colors into your visualizations.
import matplotlib.pyplot as plt

x = [1, 2, 3, 4, 5]
y = [2, 3, 5, 7, 11]

plt.plot(x, y, color='blue', label='Line with Named Color')
plt.title('Line Plot with Named Color')
plt.xlabel('X-axis')
plt.ylabel('Y-axis')
plt.legend()
plt.grid()
plt.show()
Output:
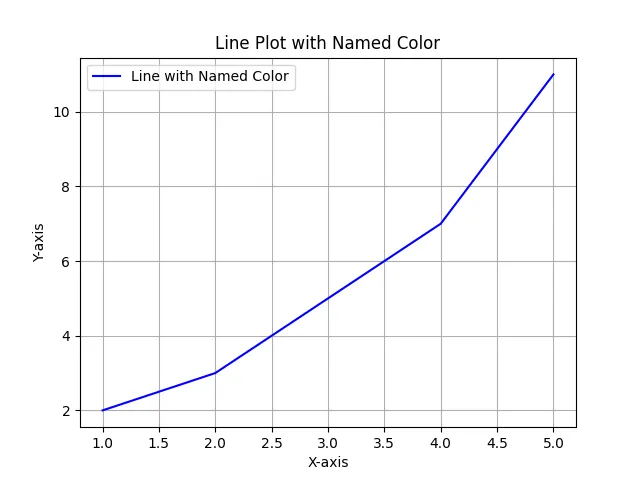
In this example, we first import the Matplotlib library and define our data points. The plt.plot() function is where the magic happens. By specifying color='blue', we tell Matplotlib to use the named color blue for our line plot. The title, labels, and legend enhance the overall presentation, making the plot not only informative but also visually appealing.
Using named colors simplifies the process of customizing plots. Instead of fiddling with RGB values, you can easily switch colors by changing the name in the color parameter. This feature is especially beneficial when creating multiple plots, as it promotes consistency and saves time.
Creating a Bar Chart with Named Colors
In addition to line plots, named colors can be used in various types of charts, such as bar charts. Let’s look at how to create a bar chart using named colors.
import matplotlib.pyplot as plt

categories = ['A', 'B', 'C', 'D']
values = [4, 7, 1, 8]

plt.bar(categories, values, color=['red', 'green', 'blue', 'orange'])
plt.title('Bar Chart with Named Colors')
plt.xlabel('Categories')
plt.ylabel('Values')
plt.show()
Output:
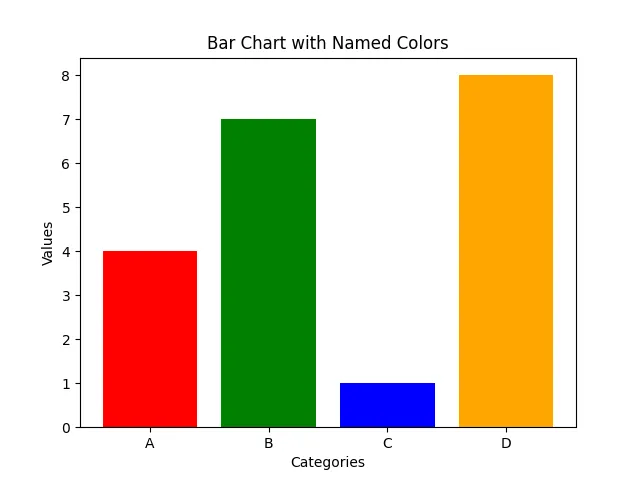
In this code, we create a bar chart with four categories. The plt.bar() function allows us to specify a list of named colors for each bar using the color parameter. This means that the first bar will be red, the second green, the third blue, and the fourth orange. The result is a colorful and engaging bar chart that clearly communicates the data.
Using named colors in bar charts not only enhances their aesthetic appeal but also helps in distinguishing different categories at a glance. This visual differentiation is crucial when presenting data, as it aids in audience comprehension and retention.
Customizing Colors with Named Colors
Named colors can also be combined with other customization options to create more dynamic visualizations. For instance, you can adjust the transparency of colors using the alpha parameter alongside named colors. Let’s see how this works with a scatter plot.
import matplotlib.pyplot as plt

x = [1, 2, 3, 4, 5]
y = [2, 3, 5, 7, 11]

plt.scatter(x, y, color='purple', alpha=0.5, label='Scatter with Transparency')
plt.title('Scatter Plot with Named Color and Transparency')
plt.xlabel('X-axis')
plt.ylabel('Y-axis')
plt.legend()
plt.grid()
plt.show()
Output:
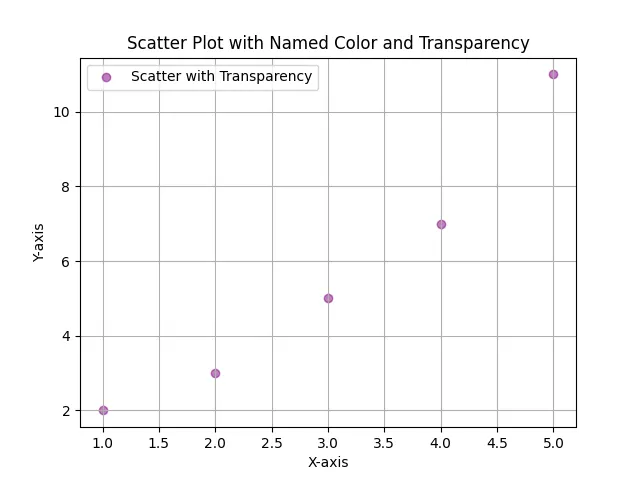
In this example, we create a scatter plot using the named color purple. The alpha parameter is set to 0.5, which gives the points a 50% transparency. This feature is particularly useful when you have overlapping data points, as it allows you to see through the points and get a better understanding of data density.
Combining named colors with transparency can significantly enhance the visual impact of your plots. It allows for a more nuanced presentation of data, making it easier for viewers to interpret complex datasets.
Conclusion
Named colors in Matplotlib provide an accessible way to enhance your data visualizations. By using these predefined color names, you can easily create visually appealing plots without worrying about complex color codes. From line plots to bar charts and scatter plots, named colors can be integrated seamlessly into your visualizations. This tutorial has explored various ways to utilize named colors, showcasing their versatility and ease of use. By incorporating named colors into your plots, you can make your data more engaging and easier to understand.
FAQ
-
What are named colors in Matplotlib?
Named colors are predefined color names in Matplotlib that can be used directly in plots without specifying RGB or HEX values. -
How can I find the list of named colors in Matplotlib?
You can find the complete list of named colors in the Matplotlib documentation or by using thematplotlib.colorsmodule. -
Can I use named colors in all types of plots?
Yes, named colors can be used in various types of plots, including line plots, bar charts, scatter plots, and more. -
How do I change the color of a plot element using named colors?
You can change the color of a plot element by specifying thecolorparameter in the plotting function and providing a named color.
- What is the benefit of using named colors?
Named colors simplify the process of customizing plots, promote consistency, and save time by eliminating the need to remember complex color codes.

Hi, my name is Maxim Maeder, I am a young programming enthusiast looking to have fun coding and teaching you some things about programming.
GitHub