How to Set Plot Background Color in Matplotlib
- Set Background Color of the Specific Matplotlib Plot
- Set Default Plot Background Color for Multiple Plots in Matplotlib
- Conclusion
- FAQ
set_facecolor(color) of the axes object sets the background color, or in other words, face color of the corresponding Matplotlib plot.

Set Background Color of the Specific Matplotlib Plot
We need to get the axes object before calling the set_facecolor() method.
1. Matlab-Alike Stateful API in Matplotlib
plt.plot(x, y)
ax = plt.gca()
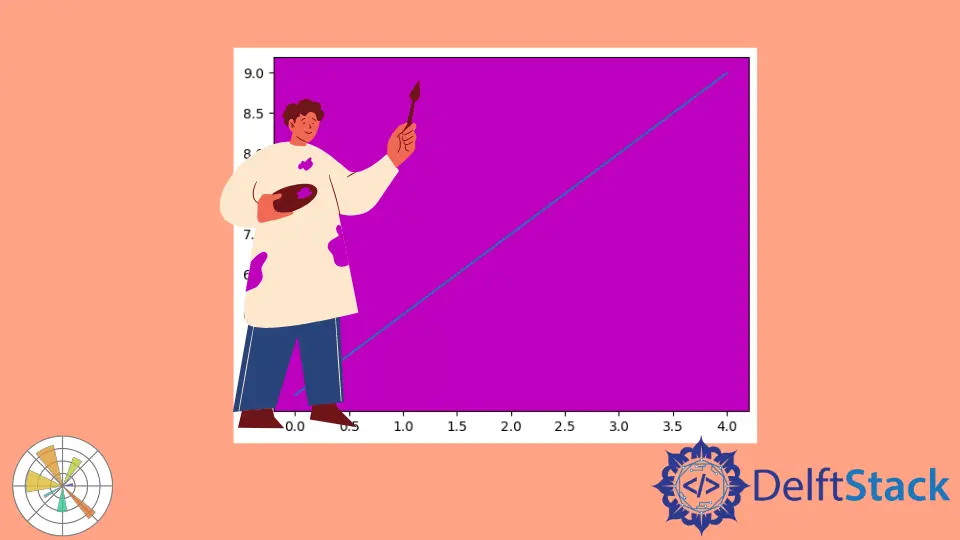
Complete Example Codes:
import matplotlib.pyplot as plt

plt.plot(range(5), range(5, 10))

ax = plt.gca()
ax.set_facecolor("m")
plt.show()
2. Create Figure and Axis in Object-Oriented Method
figure and axes objects could be created together,
fig, ax = plt.subplots()
Or create a figure first, and then initiate the axes afterward.
fig = plt.figure()
ax = fig.add_subplot(1, 1, 1)
Complete Example Codes:
import matplotlib.pyplot as plt

fig, ax = plt.subplots(1)

ax.plot(range(5), range(5, 10))

ax.set_facecolor("m")
plt.show()
Or,
import matplotlib.pyplot as plt

fig = plt.figure()
ax = fig.add_subplot(1, 1, 1)

ax.plot(range(5), range(5, 10))

ax.set_facecolor("m")
plt.show()
Set Default Plot Background Color for Multiple Plots in Matplotlib
If we need to set the default background color for multiple plots, we could set the axes.facecolor property in the rcParams object.
plt.rcParams["axes.facecolor"] = color
Complete Example Codes:
import matplotlib.pyplot as plt

plt.rcParams["axes.facecolor"] = "m"

plt.subplot(1, 2, 1)
plt.plot(range(5), range(5, 10))

plt.subplot(1, 2, 2)
plt.plot(range(5), range(10, 5, -1))

plt.show()
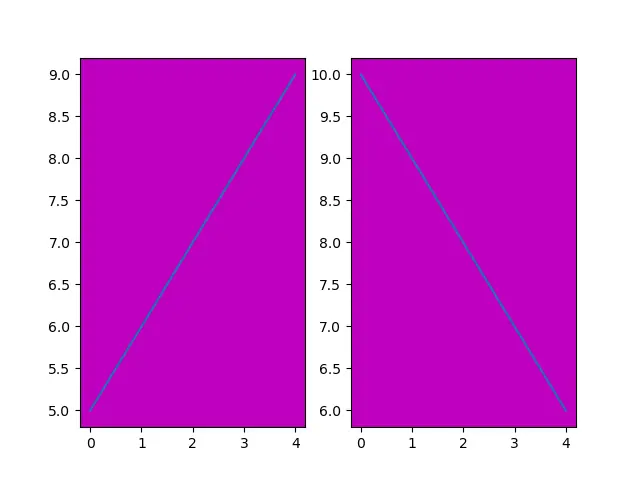
As you see, the background color of the two plots is the same.
Conclusion
Setting the plot background color in Matplotlib is a straightforward yet powerful way to enhance your data visualizations. Whether you choose to change the figure background, customize the axes, or modify the grid, each method offers unique benefits that can improve the overall aesthetic of your plots. By experimenting with different colors and styles, you can create visually appealing graphics that effectively convey your data story. With these techniques in hand, you are now ready to create stunning plots that capture attention and communicate insights effectively.
FAQ
-
How do I change the background color of a specific plot in Matplotlib?
You can change the background color of a specific plot by using theset_facecolor()method on the axes object. -
Can I use hexadecimal color codes for the background color in Matplotlib?
Yes, you can use hexadecimal color codes by passing them as strings in thefacecolororset_facecolor()methods. -
Is it possible to set different background colors for multiple subplots?
Yes, you can set different background colors for each subplot by accessing each axes object individually and using theset_facecolor()method. -
What are some common color names I can use in Matplotlib?
Common color names include ‘red’, ‘blue’, ‘green’, ‘yellow’, ‘orange’, ‘purple’, and many more. You can also use color codes for more specific shades. -
How can I make my plot background transparent?
You can make the plot background transparent by setting thefacecolorparameter to ’none’ in thefigure()function.

Founder of DelftStack.com. Jinku has worked in the robotics and automotive industries for over 8 years. He sharpened his coding skills when he needed to do the automatic testing, data collection from remote servers and report creation from the endurance test. He is from an electrical/electronics engineering background but has expanded his interest to embedded electronics, embedded programming and front-/back-end programming.
LinkedIn Facebook