Matplotlib でプロットの背景色を設定する方法
胡金庫
2023年1月30日
Matplotlib
Matplotlib Color
Matplotlib rcParams
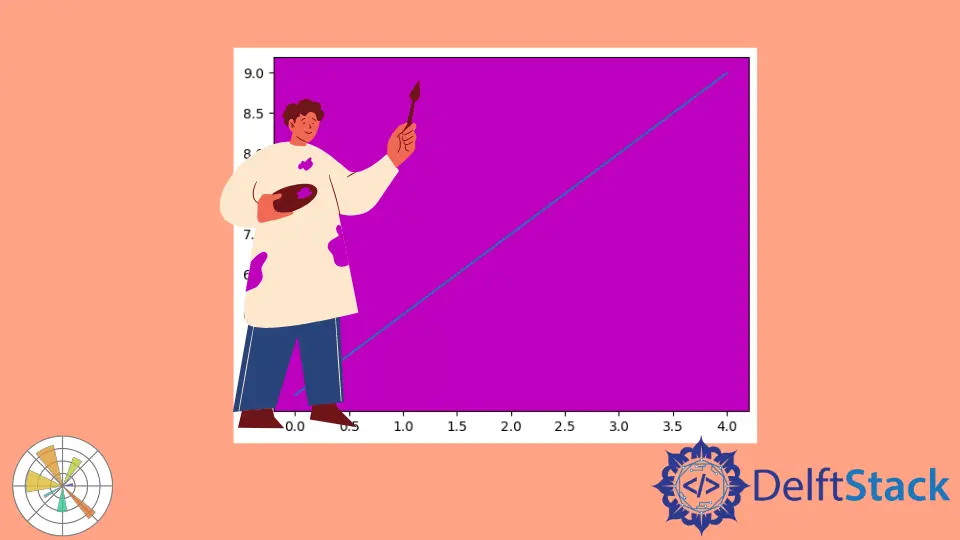
axes オブジェクトの set_facecolor(color) は背景、つまり対応するプロットの面の色を設定します。

特定のプロットの背景色を設定する
set_facecolor() メソッドを呼び出す前に、axes オブジェクトを取得する必要があります。
1. Matplotlib の Matlab に似たステートフル API
plt.plot(x, y)
ax = plt.gca()
完全なサンプルコード:
import matplotlib.pyplot as plt

plt.plot(range(5), range(5, 10))

ax = plt.gca()
ax.set_facecolor("m")
plt.show()
2.オブジェクト指向の方法で図と軸を作成する
figure と axes オブジェクトは一緒に作成できます。
fig, ax = plt.subplots()
または、最初に図を作成し、次に axis を開始します。
fig = plt.figure()
ax = fig.add_subplot(1, 1, 1)
完全なサンプルコード:
import matplotlib.pyplot as plt

fig, ax = plt.subplots(1)

ax.plot(range(5), range(5, 10))

ax.set_facecolor("m")
plt.show()
または、
import matplotlib.pyplot as plt

fig = plt.figure()
ax = fig.add_subplot(1, 1, 1)

ax.plot(range(5), range(5, 10))

ax.set_facecolor("m")
plt.show()
Matplotlib で複数のプロットのデフォルトのプロット背景色を設定する
複数のプロットにデフォルトの背景色を設定する必要がある場合、rcParams オブジェクトの axes.facecolor プロパティを設定できます。
plt.rcParams["axes.facecolor"] = color
完全なサンプルコード:
import matplotlib.pyplot as plt

plt.rcParams["axes.facecolor"] = "m"

plt.subplot(1, 2, 1)
plt.plot(range(5), range(5, 10))

plt.subplot(1, 2, 2)
plt.plot(range(5), range(10, 5, -1))

plt.show()
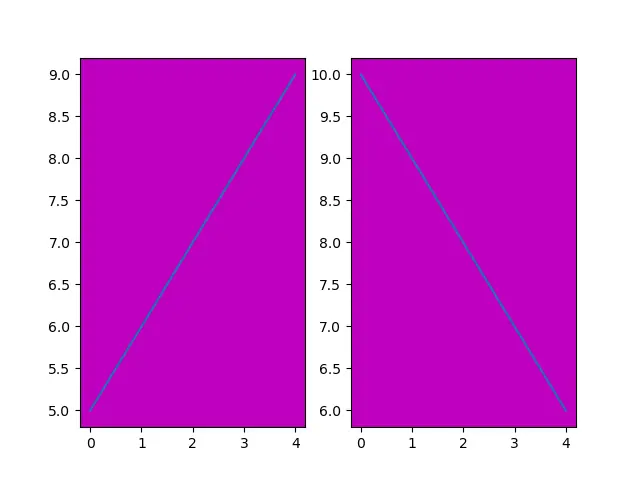
ご覧のとおり、2つのプロットの背景色は同じです。
チュートリアルを楽しんでいますか? <a href="https://www.youtube.com/@delftstack/?sub_confirmation=1" style="color: #a94442; font-weight: bold; text-decoration: underline;">DelftStackをチャンネル登録</a> して、高品質な動画ガイドをさらに制作するためのサポートをお願いします。 Subscribe
著者: 胡金庫
