How to Label Scatter Points in Matplotlib
-
Add Label to Scatter Plot Points Using the
matplotlib.pyplot.annotate()Function -
Add Label to Scatter Plot Points Using the
matplotlib.pyplot.text()Function

To label the scatter plot points in Matplotlib, we can use the matplotlib.pyplot.annotate() function, which adds a string at the specified position. Similarly, we can also use matplotlib.pyplot.text() function to add the text labels to the scatterplot points.
Add Label to Scatter Plot Points Using the matplotlib.pyplot.annotate() Function
matplotlib.pyplot.annotate(text, xy, *args, **kwargs)
It annotates the point xy with the value of the text parameter. xy represents a pair of coordinates (x, y) of the point to be annotated.
import numpy as np
import matplotlib.pyplot as plt

np.random.seed(20)

X = np.random.randint(10, size=(5))
Y = np.random.randint(10, size=(5))

annotations = ["Point-1", "Point-2", "Point-3", "Point-4", "Point-5"]

plt.figure(figsize=(8, 6))
plt.scatter(X, Y, s=100, color="red")
plt.xlabel("X")
plt.ylabel("Y")
plt.title("Scatter Plot with annotations", fontsize=15)
for i, label in enumerate(annotations):
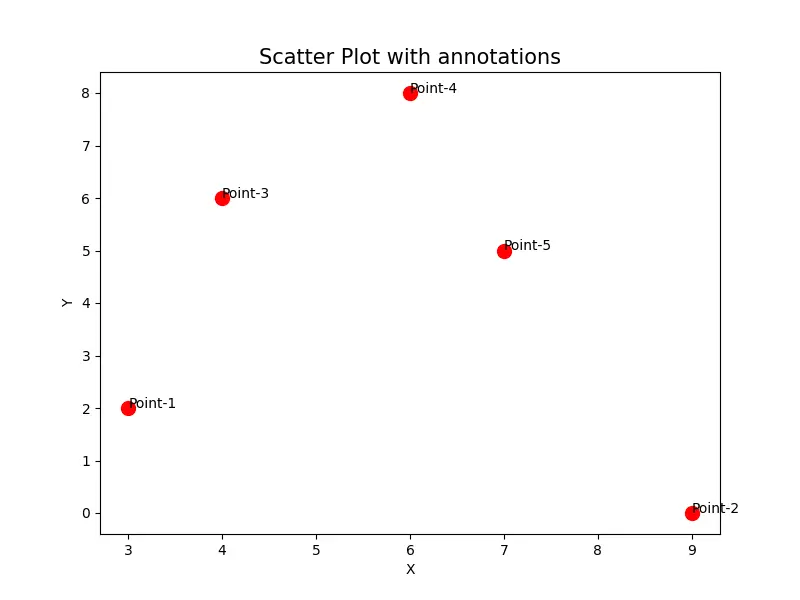
    plt.annotate(label, (X[i], Y[i]))

plt.show()
Output:

It creates two random arrays, X and Y, for X-coordinates and Y-coordinates of the points, respectively. We have a list called annotations with the same length as X and Y, which contains labels for each point. Finally, we iterate through a loop and use the annotate() method to add labels for each point in the scatter plot.
Add Label to Scatter Plot Points Using the matplotlib.pyplot.text() Function
matplotlib.pyplot.text(x, y, s, fontdict=None, **kwargs)
Here, x and y represent the coordinates where we need to place the text, and s is the content of the text that needs to be added.
The function adds text s at the point specified by x and y, where x represents the X coordinate of the point, and y represents the Y coordinate.
import numpy as np
import matplotlib.pyplot as plt

np.random.seed(20)

X = np.random.randint(10, size=(5))
Y = np.random.randint(10, size=(5))

annotations = ["Point-1", "Point-2", "Point-3", "Point-4", "Point-5"]

plt.figure(figsize=(8, 6))
plt.scatter(X, Y, s=100, color="red")
plt.xlabel("X")
plt.ylabel("Y")
plt.title("Scatter Plot with annotations", fontsize=15)
for i, label in enumerate(annotations):
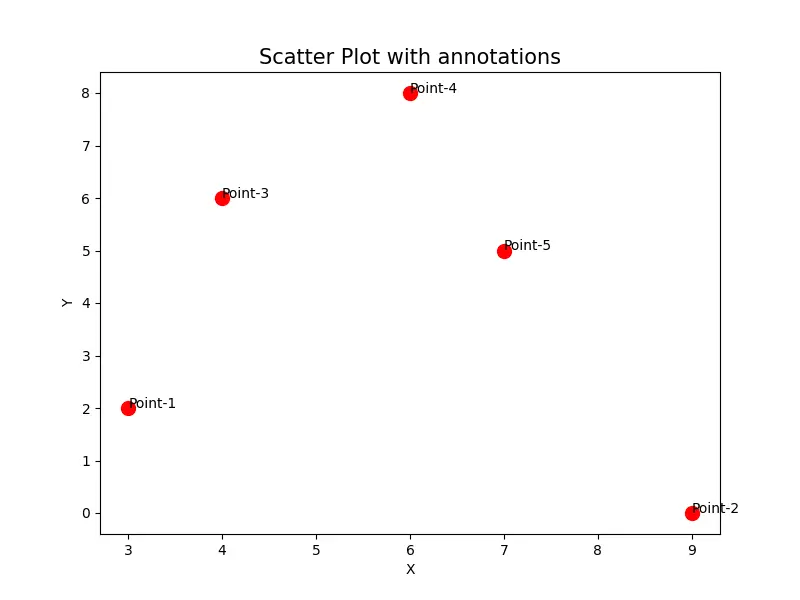
    plt.text(X[i], Y[i], label)

plt.show()
Output:

It iterates through a loop and uses the matplotlib.pyplot.text() method to add labels for each point in the scatter plot.
Suraj Joshi is a backend software engineer at Matrice.ai.
LinkedIn