How to Plot Points in Matplotlib
- Using matplotlib.pyplot.scatter()
-
Using matplotlib.
pyplot.plot() - Customizing Your Plots
- Conclusion
- FAQ
Matplotlib is a powerful library in Python that allows you to create a variety of static, animated, and interactive visualizations. One of the most common tasks in data visualization is plotting points on a graph, which can help you understand your data better.
In this tutorial, we will explore two primary methods for plotting points in Matplotlib: the matplotlib.pyplot.scatter() method and the matplotlib.pyplot.plot() method. Whether you’re working with scientific data, financial data, or any other type of dataset, mastering these techniques will enhance your ability to present your findings visually. Let’s dive in and learn how to plot points effectively using Matplotlib.
Using matplotlib.pyplot.scatter()
The scatter() method is specifically designed for creating scatter plots, which are particularly useful for visualizing the relationship between two variables. Scatter plots allow you to see how one variable is affected by another, making them an essential tool for data analysis.
Here’s a simple example of how to use the scatter() method in Matplotlib:
import matplotlib.pyplot as plt
x = [1, 2, 3, 4, 5, 6]
y = [2, 1, 5, 6, 3, 9]
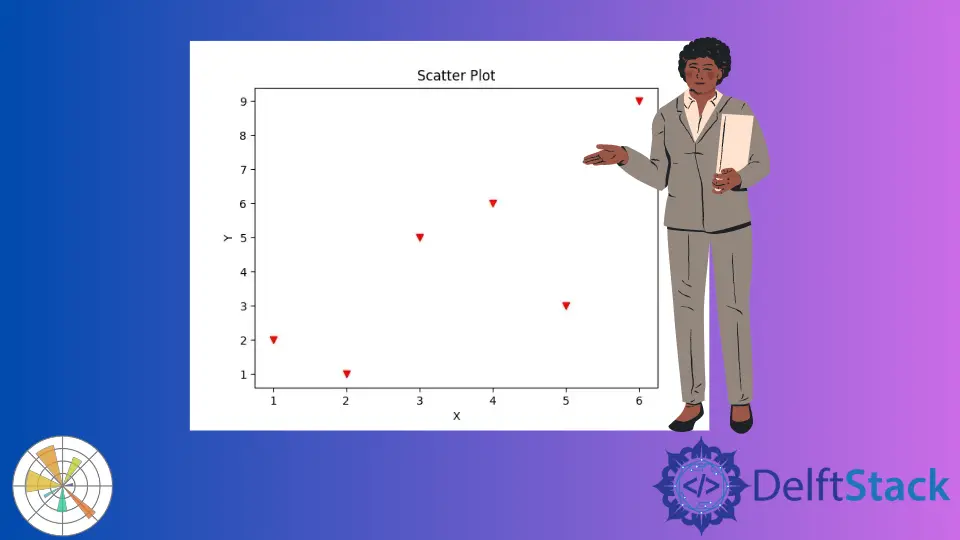
plt.scatter(x, y)
plt.xlabel("X")
plt.ylabel("Y")
plt.title("Scatter Plot")
plt.show()
Output:

It generates a simple scatter plot from the given data points. We pass X and Y coordinates as arguments to the scatter() method to produce the scatter plot. The xlabel() and the ylabel() methods will set the X-axis and Y-axis labels respectively. The title() method will set the title for the figure.
Using matplotlib.pyplot.plot()
The plot() method is more versatile and can be used to create various types of plots, including line plots and scatter plots. When using plot() for scatter plots, you can specify the marker style to achieve a similar effect to scatter().
Here’s how to use the plot() method to plot points:
By default, the matplotlib.pyplot.plot() method will connect all the points with a single line. To generate the scatter plot using the matplotlib.pyplot.plot(), we set the character to represent the marker as the third argument in the method.
import matplotlib.pyplot as plt

x = [1, 2, 3, 4, 5, 6]
y = [2, 1, 5, 6, 3, 9]

plt.plot(
    x,
    y,
    "o",
    color="red",
)
plt.xlabel("X")
plt.ylabel("Y")
plt.title("Scatter Plot")
plt.show()
Output:
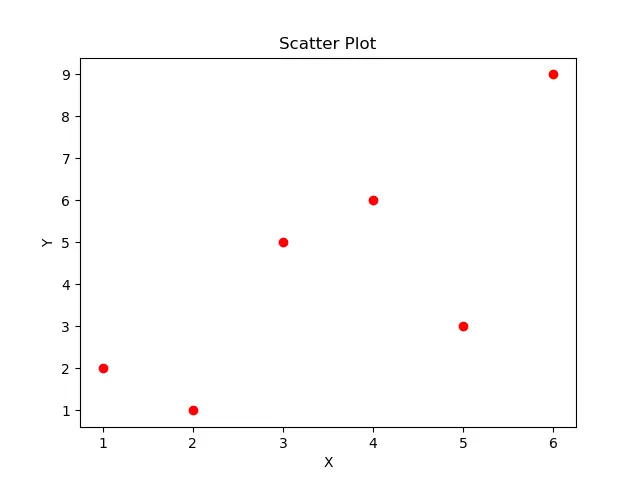
It generates the scatter plot from the data with o as a marker in red color to represent data points.
In this example, we again define our x and y lists. The key difference here is that we use the plot() function with the 'o' argument, which specifies that we want circle markers. This allows us to create a scatter-like effect while still using the plot() function. The flexibility of the plot() method makes it a great choice when you want to combine line and point plots, or if you want to apply additional features like connecting the points with lines.
Customizing Your Plots
Both scatter() and plot() offer a variety of customization options that can enhance your visualizations. You can change colors, marker styles, and even add annotations to your plots.
For instance, you can modify the size of the markers in the scatter() method using the s parameter:
plt.scatter(x, y, color='green', s=100) # s is the size of markers
In the plot() method, you can also customize line styles and colors. For example, you can add a line between points:
plt.plot(x, y, marker='o', linestyle='-', color='purple')
By exploring these options, you can create more engaging and informative visualizations that effectively communicate your data’s story.
Conclusion
In this tutorial, we explored two essential methods for plotting points in Matplotlib: scatter() and plot(). Each method has its unique strengths, and understanding when to use each one can significantly enhance your data visualization skills. Whether you’re creating simple scatter plots or combining points with lines, Matplotlib provides the tools you need to present your data effectively. So, go ahead and experiment with these methods to make your data visualizations stand out!
FAQ
-
What is the difference between scatter and plot in Matplotlib?
scatter is specifically for scatter plots, while plot can create various types of plots, including line and scatter plots. -
Can I customize the markers in Matplotlib?
Yes, both scatter and plot allow you to customize marker styles, sizes, and colors. -
How do I save my Matplotlib plot as an image?
You can use plt.savefig(‘filename.png’) to save your plot in various formats. -
Is Matplotlib suitable for interactive visualizations?
Yes, Matplotlib can create interactive plots, especially when combined with other libraries like Jupyter notebooks. -
Can I add annotations to my plots in Matplotlib?
Yes, you can use plt.annotate() to add text annotations to specific points on your plots.

Suraj Joshi is a backend software engineer at Matrice.ai.
LinkedIn