How to Create Density Plot in Matplotlib
-
Generate the Density Plot Using the
gaussian_kde()Method From thescipy.statsModule -
Generate the Density Plot Using the
kdeplot()Method From theseabornPackage -
Generate the Density Plot Using the
distplot()Method From theseabornPackage -
Set
kind='density'inpandas.DataFrame.plot()Method to Generate the Density Plot

To generate a density plot using Python, we at first estimate the density function from the given data using the gaussian_kde() method from the scipy.stats module. We then plot the density function to generate the density plot. Alternatively, we can also use kdeplot() from the seaborn package or set kind='density' in pandas.DataFrame.plot() method to generate the density plot.
Generate the Density Plot Using the gaussian_kde() Method From the scipy.stats Module
import numpy as np
import matplotlib.pyplot as plt
from scipy.stats import kde

data = [2, 3, 3, 4, 2, 1, 5, 6, 4, 3, 3, 3, 6, 4, 5, 4, 3, 2]
density = kde.gaussian_kde(data)
x = np.linspace(-2, 10, 300)
y = density(x)

plt.plot(x, y)
plt.title("Density Plot of the data")
plt.show()
Output:

Here, we first estimate the density function for the given data using the gaussian_kde() method. Then, we plot the function for values ranging from -2 to 10 using the plot() method.
The density plot generated is not precise enough because the gaussian_kde function sets the bandwidth automatically. To set the bandwidth, we can use the covariance_factor function of the gaussian_kde class. We then call the _compute_covariance method so that all the factors are computed correctly to generate the precise plot.
import numpy as np
import matplotlib.pyplot as plt
from scipy.stats import kde

data = [2, 3, 3, 4, 2, 1, 5, 6, 4, 3, 3, 3, 6, 4, 5, 4, 3, 2]
prob_density = kde.gaussian_kde(data)
prob_density.covariance_factor = lambda: 0.25
prob_density._compute_covariance()

x = np.linspace(-2, 10, 300)
y = prob_density(x)

plt.plot(x, y)
plt.title("Density Plot of the data")
plt.show()
Output:

Generate the Density Plot Using the kdeplot() Method From the seaborn Package
import matplotlib.pyplot as plt
import seaborn as sns

data = [2, 3, 3, 4, 2, 1, 5, 6, 4, 3, 3, 3, 6, 4, 5, 4, 3, 2]
sns.kdeplot(data, bw=0.25)
plt.show()
Output:
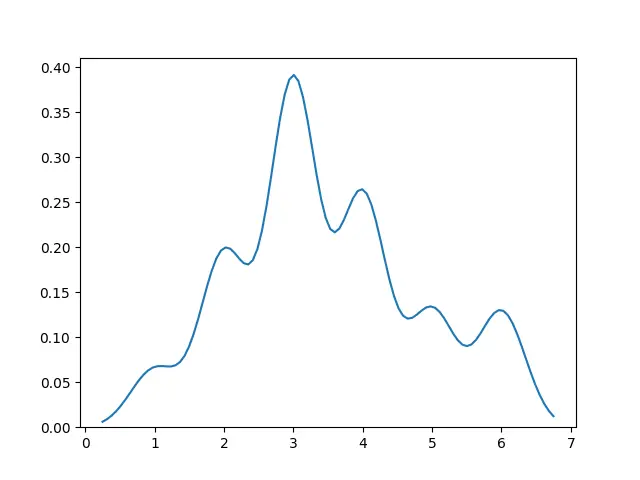
In this way, we can generate the density plot by simply passing data into the kdeplot() method.
Generate the Density Plot Using the distplot() Method From the seaborn Package
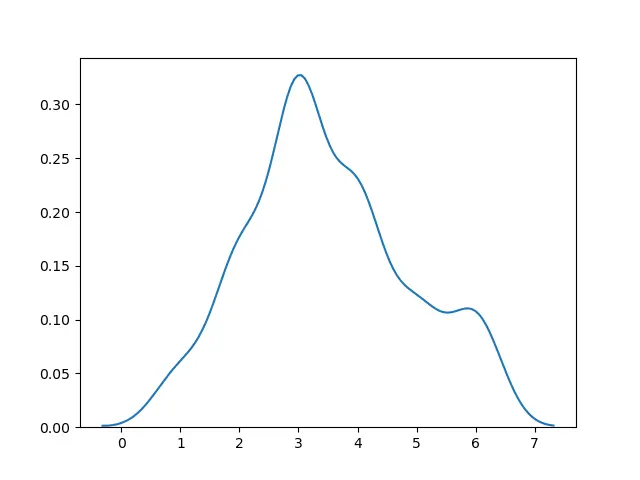
We can also use the distplot() method from the seaborn package to and set hist=False to generate the density plot.
import matplotlib.pyplot as plt
import seaborn as sns

data = [2, 3, 3, 4, 2, 1, 5, 6, 4, 3, 3, 3, 6, 4, 5, 4, 3, 2]
sns.distplot(data, hist=False)
plt.show()
Output:
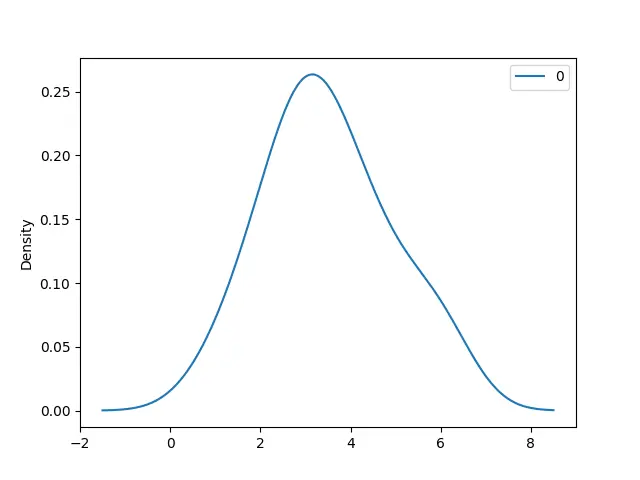
Set kind='density' in pandas.DataFrame.plot() Method to Generate the Density Plot
import pandas as pd
import matplotlib.pyplot as plt

data = [2, 3, 3, 4, 2, 1, 5, 6, 4, 3, 3, 3, 6, 4, 5, 4, 3, 2]
df = pd.DataFrame(data)
df.plot(kind="density")
plt.show()
Output:

Suraj Joshi is a backend software engineer at Matrice.ai.
LinkedIn