How to Plot Contour in Matplotlib
-
Use the
contour()Method to Obtain Contour Plot in Matplotlib -
Use the
contourf()Method in Matplotlib
In this demonstration, we will see what a contour plot is and how we can obtain contour plots with the help of the contour() method in Matplotlib.
Use the contour() Method to Obtain Contour Plot in Matplotlib
The contour plots have a way of showing a three-dimensional surface on a two-dimensional plane. It graphs two predicted variables, x and y, on the y axis and a response variable, z, as contours.
A contour plot in two dimensions is the isoline of a scalar field that depends on two variables. Let’s discretize the variables in each of the axes.
We will start with a discretized x component which we can create with the help of numpy.linspace().Then, we import numpy.
We want to have x linearly spaced from -2 to 2 with 500 values. For y, we want to do the same also.
import matplotlib.pyplot as plot
import numpy as np

x = np.linspace(-2, 2, 500)
y = np.linspace(-2, 2, 500)
We can create a two-dimensional mesh using the np.meshgrid() method, which will be saved in capital x and capital y. Then we can evaluate our scalar field using the sin of x and cos of y.
x, y = np.meshgrid(x, y)
z = np.sin(x) + np.cos(y)
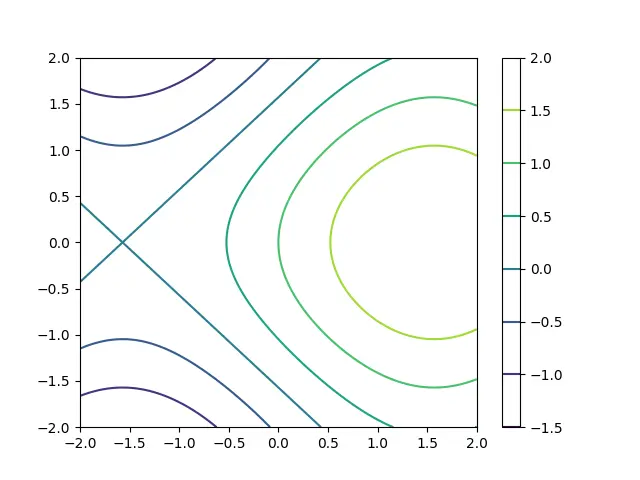
The contour plot is created using the contour() method and accepts three parameters. We see the isolines of the function together with a color key.
For the value of the scalar field at this position, we can activate a color scale using plot.colorbar() to get information on which value is indicated with a certain color.
plot.contour(x, y, z)
plot.colorbar()
Full Source Code:
import matplotlib.pyplot as plot
import numpy as np

x = np.linspace(-2, 2, 500)
y = np.linspace(-2, 2, 500)
x, y = np.meshgrid(x, y)
z = np.sin(x) + np.cos(y)

plot.contour(x, y, z)
plot.colorbar()
plot.show()
Output:
Use the contourf() Method in Matplotlib
Another method called contourf() creates a contour plot, but the intermediary areas are filled with the corresponding color value.
Code:
import matplotlib.pyplot as plot
import numpy as np

x = np.linspace(-2, 2, 500)
y = np.linspace(-2, 2, 500)
x, y = np.meshgrid(x, y)
z = np.sin(x) + np.cos(y)

plot.contourf(x, y, z)
plot.colorbar()
plot.show()
Output:
-method-in-matplotlib.webp)
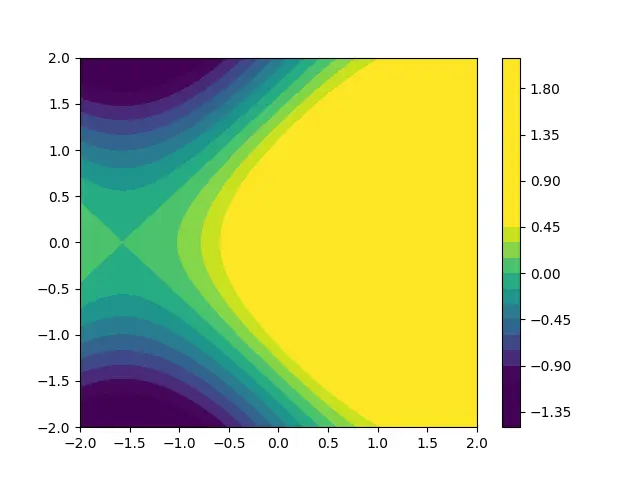
Using the levels argument, we can change the number of levels. The levels are the number of isolines.
Let’s, for instance, create 30 isolines and then see the transition is way smoother. We can also manually select which value to which value we want to have isolines, for instance, with vmin being -1 and vmax being 0.5.
When we run the following code, we can not cover the yellow area with isolines because its value is too high.
Code:
import matplotlib.pyplot as plot
import numpy as np

x = np.linspace(-2, 2, 500)
y = np.linspace(-2, 2, 500)
x, y = np.meshgrid(x, y)
z = np.sin(x) + np.cos(y)

plot.contourf(x, y, z, levels=30, vmin=-1, vmax=0.5)
plot.colorbar()
plot.show()
Output:

Hello! I am Salman Bin Mehmood(Baum), a software developer and I help organizations, address complex problems. My expertise lies within back-end, data science and machine learning. I am a lifelong learner, currently working on metaverse, and enrolled in a course building an AI application with python. I love solving problems and developing bug-free software for people. I write content related to python and hot Technologies.
LinkedIn