How to Turn Off the Axes for Subplots in Matplotlib
-
matplotlib.axes.Axes.axis() -
matplotlib.axes.Axes.set_axis_off() -
matplotlib.pyplot.axis() -
get_xaxis().set_visible()andget_yaxis().set_visible()
We can turn off the axes of subplots in Matplotlib using axis() and set_axis_off() methods for axes objects. We can also turn off axes using the axis() method for the pyplot object. To turn off axis for X-axis in particular we use axes.get_xaxis().set_visible() and to turn off axis for Y-axis in particular we use axes.get_yaxis().set_visible() method.
matplotlib.axes.Axes.axis()
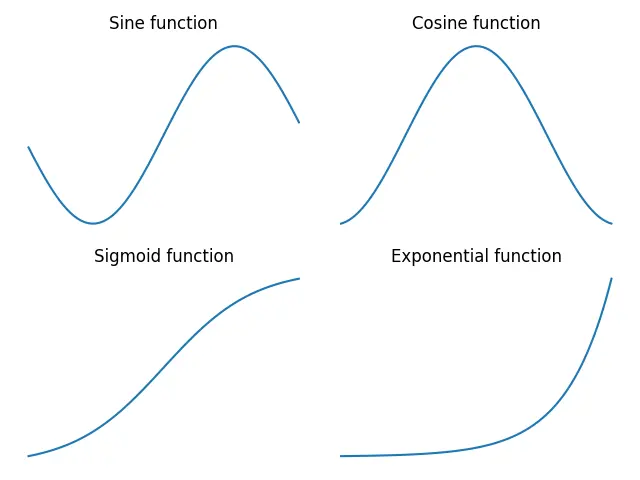
To turn off the axes for subplots, we pass off as a parameter to matplotlib.axes.Axes.axis() method.
import numpy as np
import matplotlib.pyplot as plt

x = np.linspace(-3, 3, 100)
y1 = np.sin(x)
y2 = np.cos(x)
y3 = 1 / (1 + np.exp(-x))
y4 = np.exp(x)

fig, ax = plt.subplots(2, 2)

ax[0, 0].plot(x, y1)
ax[0, 0].set_title("Sine function")
ax[0, 0].axis("off")

ax[0, 1].plot(x, y2)
ax[0, 1].set_title("Cosine function")
ax[0, 1].axis("off")


ax[1, 0].plot(x, y3)
ax[1, 0].set_title("Sigmoid function")
ax[1, 0].axis("off")


ax[1, 1].plot(x, y4)
ax[1, 1].set_title("Exponential function")
ax[1, 1].axis("off")

fig.tight_layout()
plt.show()
Output:

Here, we turn off axes for each subplot using axes.axis("off") method.
matplotlib.axes.Axes.set_axis_off()
We use matplotlib.axes.Axes.set_axis_off() to turn the x- and y-axis off affecting the axis lines, ticks, ticklabels, grid and axis labels too.
import numpy as np
import matplotlib.pyplot as plt

x = np.linspace(-3, 3, 100)
y1 = np.sin(x)
y2 = np.cos(x)
y3 = 1 / (1 + np.exp(-x))
y4 = np.exp(x)

fig, ax = plt.subplots(2, 2)

ax[0, 0].plot(x, y1)
ax[0, 0].set_title("Sine function")
ax[0, 0].set_axis_off()

ax[0, 1].plot(x, y2)
ax[0, 1].set_title("Cosine function")
ax[0, 1].set_axis_off()


ax[1, 0].plot(x, y3)
ax[1, 0].set_title("Sigmoid function")
ax[1, 0].set_axis_off()


ax[1, 1].plot(x, y4)
ax[1, 1].set_title("Exponential function")
ax[1, 1].set_axis_off()

fig.tight_layout()
plt.show()
Output:
matplotlib.pyplot.axis()
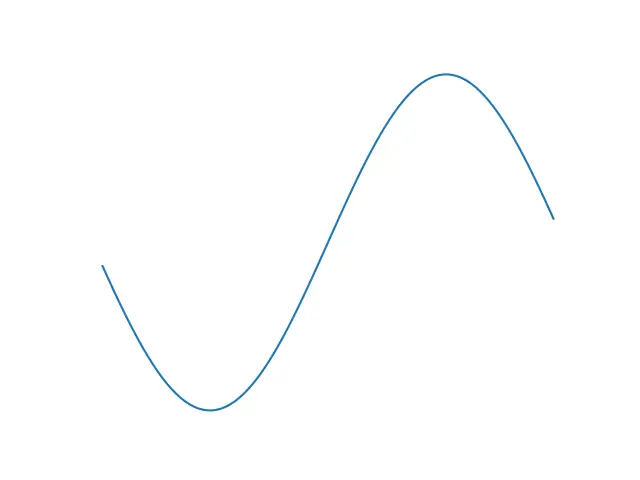
If a figure has a single plot in it, we can turn off the axes for subplots by passing off as an argument to the matplotlib.pyplot.axis() method. However, if the figure contains multiple subplots, this method only turns off axes for the last subplot.
import numpy as np
import matplotlib.pyplot as plt

x = np.linspace(-3, 3, 100)
y = np.sin(x)

plt.plot(x, y)
plt.axis("off")
plt.show()
Output:
get_xaxis().set_visible() and get_yaxis().set_visible()
We can turn off X-axis by passing False as an argument to get_xaxis().set_visible(). And to turn off Y-axis we pass False as an argument to get_yaxis().set_visible(). We can make single axis turn off using this function.
import numpy as np
import matplotlib.pyplot as plt

x = np.linspace(-3, 3, 100)
y1 = np.sin(x)
y2 = np.cos(x)
y3 = 1 / (1 + np.exp(-x))
y4 = np.exp(x)

fig, ax = plt.subplots(2, 2)

ax[0, 0].plot(x, y1)
ax[0, 0].set_title("Sine function")
ax[0, 0].get_xaxis().set_visible(False)
ax[0, 0].get_yaxis().set_visible(False)

ax[0, 1].plot(x, y2)
ax[0, 1].set_title("Cosine function")
ax[0, 1].get_xaxis().set_visible(False)
ax[0, 1].get_yaxis().set_visible(False)


ax[1, 0].plot(x, y3)
ax[1, 0].set_title("Sigmoid function")
ax[1, 0].get_xaxis().set_visible(False)
ax[1, 0].get_yaxis().set_visible(False)


ax[1, 1].plot(x, y4)
ax[1, 1].set_title("Exponential function")
ax[1, 1].get_xaxis().set_visible(False)
ax[1, 1].get_yaxis().set_visible(False)

fig.tight_layout()
plt.show()
Output:
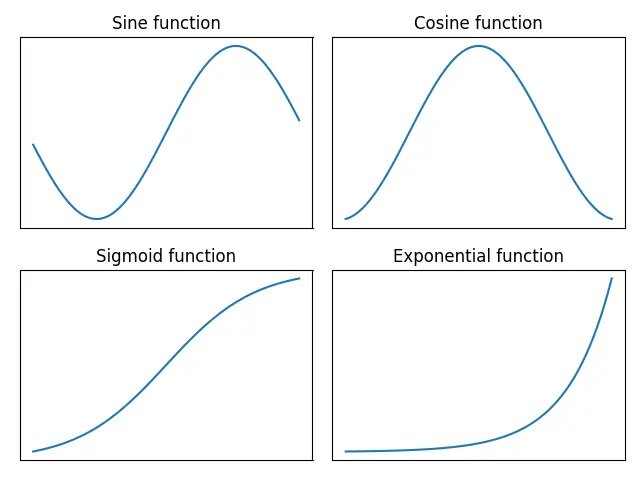
However, this method has no effect on the frame of the plot. To turn the frame off , we pass keyword argument frameon=False to plt.axes() method.

Suraj Joshi is a backend software engineer at Matrice.ai.
LinkedIn