Matplotlib에서 서브 플롯의 축을 끄는 방법
-
matplotlib.axes.Axes.axis() -
matplotlib.axes.Axes.set_axis_off() -
matplotlib.pyplot.axis() -
get_xaxis().set_visible()및get_yaxis().set_visible()
좌표축 객체에 대해axis()및set_axis_off()메소드를 사용하여 Matplotlib에서 서브 플롯의 축을 끌 수 있습니다. pyplot 객체에axis()메소드를 사용하여 좌표축을 끌 수도 있습니다. 특히 X 축의 축을 끄려면axes.get_xaxis().set_visible()을 사용하고 특히 Y 축의 축을 끄려면 axes.get_yaxis().set_visible()메소드를 사용합니다.
matplotlib.axes.Axes.axis()
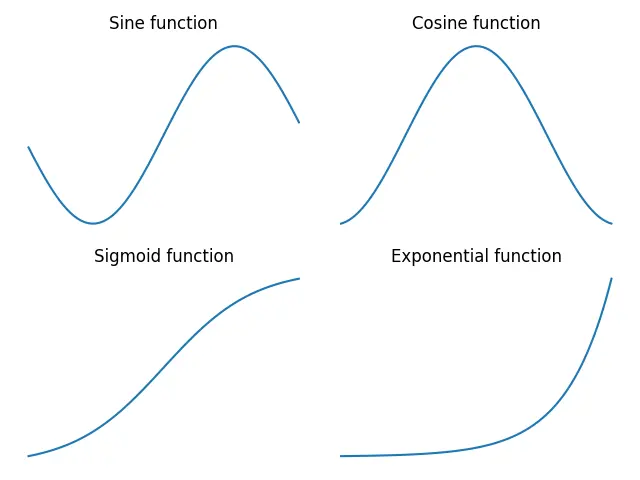
서브 플롯의 축을 끄려면off를 매개 변수로 matplotlib.axes.Axes.axis() 에 전달합니다.
import numpy as np
import matplotlib.pyplot as plt

x = np.linspace(-3, 3, 100)
y1 = np.sin(x)
y2 = np.cos(x)
y3 = 1 / (1 + np.exp(-x))
y4 = np.exp(x)

fig, ax = plt.subplots(2, 2)

ax[0, 0].plot(x, y1)
ax[0, 0].set_title("Sine function")
ax[0, 0].axis("off")

ax[0, 1].plot(x, y2)
ax[0, 1].set_title("Cosine function")
ax[0, 1].axis("off")


ax[1, 0].plot(x, y3)
ax[1, 0].set_title("Sigmoid function")
ax[1, 0].axis("off")


ax[1, 1].plot(x, y4)
ax[1, 1].set_title("Exponential function")
ax[1, 1].axis("off")

fig.tight_layout()
plt.show()
출력:

여기에서는axes.axis("off")방법을 사용하여 각 서브 플롯의 축을 끕니다.
matplotlib.axes.Axes.set_axis_off()
matplotlib.axes.Axes.set_axis_off()을 사용하여 x와 y를 축선, 눈금, 눈금 레이블, 격자 및 축 레이블에도 영향을 미치는 축 꺼짐.
import numpy as np
import matplotlib.pyplot as plt

x = np.linspace(-3, 3, 100)
y1 = np.sin(x)
y2 = np.cos(x)
y3 = 1 / (1 + np.exp(-x))
y4 = np.exp(x)

fig, ax = plt.subplots(2, 2)

ax[0, 0].plot(x, y1)
ax[0, 0].set_title("Sine function")
ax[0, 0].set_axis_off()

ax[0, 1].plot(x, y2)
ax[0, 1].set_title("Cosine function")
ax[0, 1].set_axis_off()


ax[1, 0].plot(x, y3)
ax[1, 0].set_title("Sigmoid function")
ax[1, 0].set_axis_off()


ax[1, 1].plot(x, y4)
ax[1, 1].set_title("Exponential function")
ax[1, 1].set_axis_off()

fig.tight_layout()
plt.show()
출력:
matplotlib.pyplot.axis()
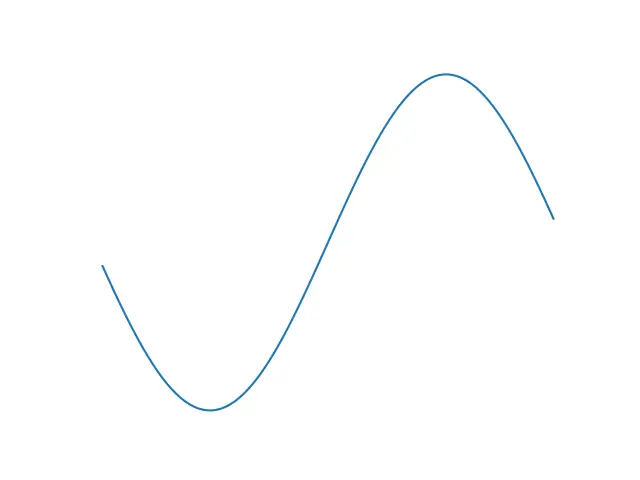
그림에 단일 플롯이있는 경우 [off]를 matplotlib.pyplot.axis() 메소드에 인수로 전달하여 서브 플롯의 축을 끌 수 있습니다. 그러나 그림에 여러 서브 플롯이 포함 된 경우이 방법은 마지막 서브 플롯의 축만 끕니다.
import numpy as np
import matplotlib.pyplot as plt

x = np.linspace(-3, 3, 100)
y = np.sin(x)

plt.plot(x, y)
plt.axis("off")
plt.show()
출력:
get_xaxis().set_visible()및get_yaxis().set_visible()
False를get_xaxis().set_visible()에 인수로 전달하여 X 축을 끌 수 있습니다. 그리고 Y 축을 끄려면False를get_yaxis().set_visible()에 인수로 전달합니다. 이 기능을 사용하여 단축을 끌 수 있습니다.
import numpy as np
import matplotlib.pyplot as plt

x = np.linspace(-3, 3, 100)
y1 = np.sin(x)
y2 = np.cos(x)
y3 = 1 / (1 + np.exp(-x))
y4 = np.exp(x)

fig, ax = plt.subplots(2, 2)

ax[0, 0].plot(x, y1)
ax[0, 0].set_title("Sine function")
ax[0, 0].get_xaxis().set_visible(False)
ax[0, 0].get_yaxis().set_visible(False)

ax[0, 1].plot(x, y2)
ax[0, 1].set_title("Cosine function")
ax[0, 1].get_xaxis().set_visible(False)
ax[0, 1].get_yaxis().set_visible(False)


ax[1, 0].plot(x, y3)
ax[1, 0].set_title("Sigmoid function")
ax[1, 0].get_xaxis().set_visible(False)
ax[1, 0].get_yaxis().set_visible(False)


ax[1, 1].plot(x, y4)
ax[1, 1].set_title("Exponential function")
ax[1, 1].get_xaxis().set_visible(False)
ax[1, 1].get_yaxis().set_visible(False)

fig.tight_layout()
plt.show()
출력:
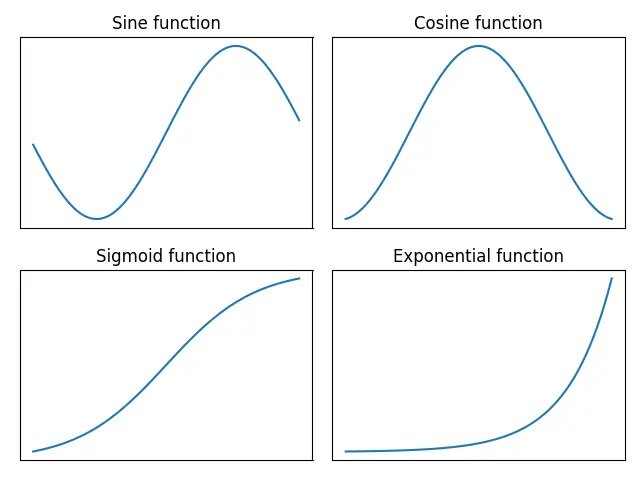
그러나이 방법은 플롯의 프레임에 영향을 미치지 않습니다. 프레임을 끄려면 키워드 인수frameon=False를plt.axes()메소드에 전달합니다.

Suraj Joshi is a backend software engineer at Matrice.ai.
LinkedIn