Pandas DataFrame DataFrame.boxplot() Function
-
Syntax of
pandas.DataFrame.boxplot(): -
Example Codes: Generate Boxplot With
pandas.DataFrame.boxplot() -
Example Codes: Generate Boxplot Grouping Data Based on Column Values With
pandas.DataFrame.boxplot() -
Set
layoutParameter to Change Layout of Boxplots
pandas.DataFrame.boxplot() makes a box-and-whisker plot from DataFrame columns. A box and whisker plot summarizes the minimum, first quartile, median, third quartile, and maximum value of data.
Syntax of pandas.DataFrame.boxplot():
DataFrame.boxplot(
    column=None,
    by=None,
    ax=None,
    fontsize=None,
    rot=0,
    grid=True,
    figsize=None,
    layout=None,
    return_type=None,
    backend=None,
    **kwargs
)
Parameters
column |
Column name from which boxplot has to be generated |
by |
Plots different boxplots grouping by columns in different groups. |
ax |
Matplotlib axes to be used by boxplot |
grid |
Boolean. Turn grids on (True) and off(False) |
rot |
Integer. Rotation angle for the label along the X-axis |
fontsize |
Font size of labels in Boxplot |
layout |
Parameter used to control or set the layout of Boxplot |
return_type |
Object type to return |
backend |
Backend to use instead of the backend specified in the option plotting.backend. |
**kwargs |
Keyword arguments for the method |
Example Codes: Generate Boxplot With pandas.DataFrame.boxplot()
import pandas as pd
import matplotlib.pyplot as plt

fruits=['Apple', 'Papaya', 'Banana', 'Mango','Litchi','Avocado']
prices=[3, 1, 2, 4,4,5]

df = pd.DataFrame({'Fruit':fruits ,
                   'Price': prices})
print(df)

boxplot = df.boxplot(column=['Price'])
boxplot.plot()

plt.show()
Output:
It generates a boxplot from the prices column of DataFrame. We use matplotlib.pyplot to show the generated plot.
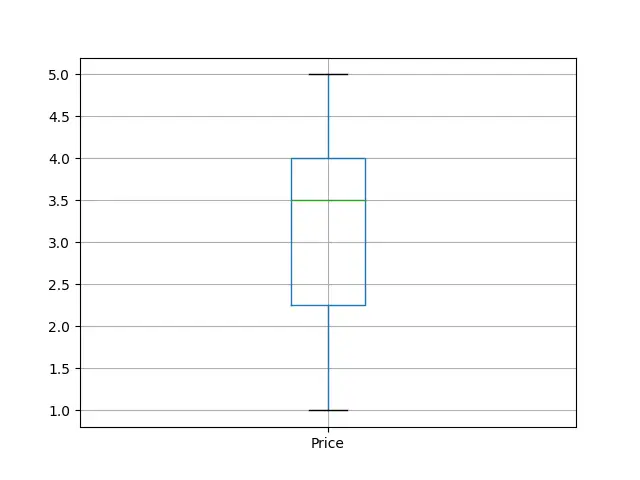
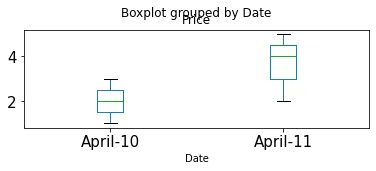
Example Codes: Generate Boxplot Grouping Data Based on Column Values With pandas.DataFrame.boxplot()
import pandas as pd
import numpy as np
import sklearn

dates=['April-10', 'April-10', 'April-11', 'April-11','April-11']
prices=[3, 1, 2, 4,5]

df = pd.DataFrame({'Date':dates ,
                   'Price': prices})
print(df)

boxplot = df.boxplot(column=['Price'],by="Date")
boxplot.plot()

plt.show()
Output:
At first, it groups the given DataFrame into different groups based on their value of the Date column and then generates a boxplot for each DataFrame.
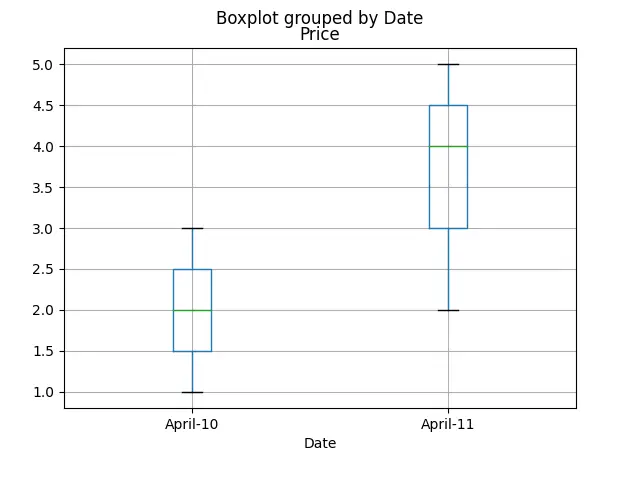
We can customize our plot using fontsize, rot, and grid parameters.
import pandas as pd
import matplotlib.pyplot as plt

dates=['April-10', 'April-10', 'April-11', 'April-11','April-11']
prices=[3, 1, 2, 4,5]

df = pd.DataFrame({'Date':dates ,
                   'Price': prices})
print(df)

boxplot = df.boxplot(column=['Price'],by="Date",grid=False, rot=45, fontsize=15)
boxplot.plot()

plt.show()
Output:
Here, grid=False turns off the grid, rot=45 rotates the X-axis labels by 45 degrees, and fontsize=15 changes the font size to 15.
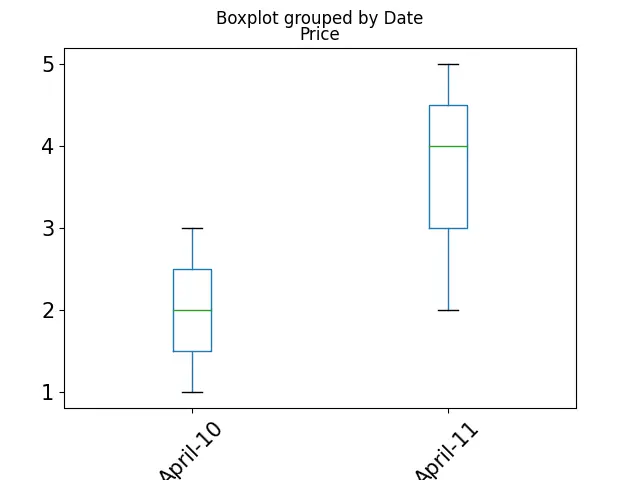
Set layout Parameter to Change Layout of Boxplots
import pandas as pd

dates=['April-10', 'April-10', 'April-11', 'April-11','April-11']
prices=[3, 1, 2, 4,5]


df = pd.DataFrame({'Date':dates ,

boxplot = df.boxplot(column=['Price'],by="Date",layout=(2,1),grid=False,fontsize=15)
Output:
Here, the layout parameter changes the layout of the boxplot generated. layout=(2,1) aligns the boxplots in 2 rows and a column.

Suraj Joshi is a backend software engineer at Matrice.ai.
LinkedIn