Matplotlib Tutorial - Axes Title
In this tutorial we’re going to learn about axis title in Matplotlib.
Matplotlib Axes Title
Syntax:
matplotlib.pyplot.title(label, fontdict=None, loc=None, **kwargs)
It sets a title of the current axes.
Parameters
| Name | Data Type | Description |
|---|---|---|
label |
str |
label text |
fontdict |
dict |
label text font dictionary, like family, color, weight and size |
loc |
str |
The location of the title. It has three options, {'center', 'left', 'right'} and the default option is center |
# -*- coding: utf-8 -*-
import numpy as np
import matplotlib.pyplot as plt
x = np.linspace(0, 4 * np.pi, 1000)
y = np.sin(x)
plt.figure(figsize=(4, 3))
plt.plot(x, y, "r")
plt.xlabel(
"Time (s)",
size=16,
)
plt.ylabel("Value", size=16)
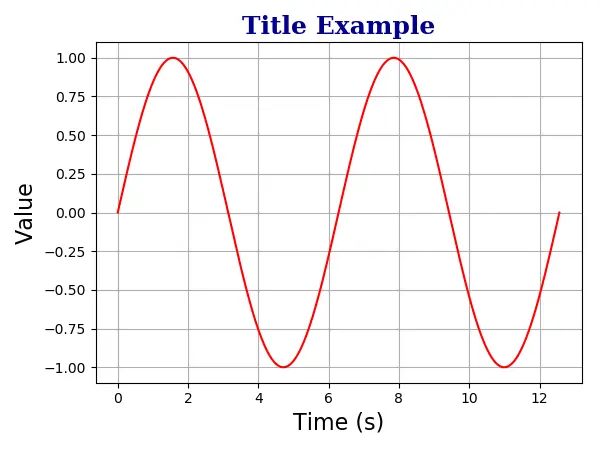
plt.title(
"Title Example",
fontdict={"family": "serif", "color": "darkblue", "weight": "bold", "size": 18},
)
plt.grid(True)
plt.show()
plt.title(
    "Title Example",
    fontdict={"family": "serif", "color": "darkblue", "weight": "bold", "size": 18},
)
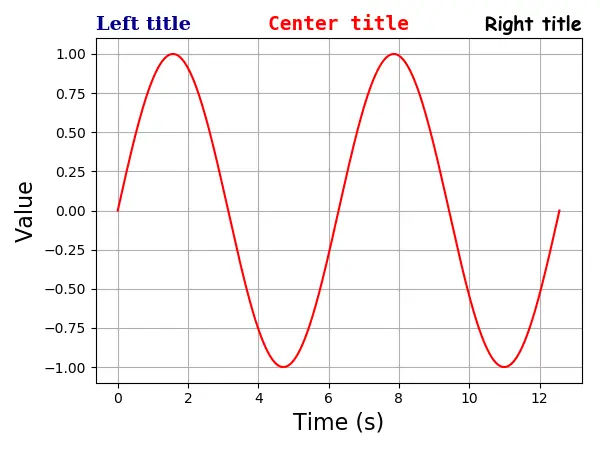
Matplotlib Axis Multiple Titles
One axis could have at most three titles that are in the position left, center and right. The position of the specific title is specified with loc argument.
# -*- coding: utf-8 -*-
import numpy as np
import matplotlib.pyplot as plt

x = np.linspace(0, 4 * np.pi, 1000)
y = np.sin(x)

plt.figure(figsize=(8, 6))

plt.plot(x, y, "r")
plt.xlabel(
    "Time (s)",
    size=16,
)
plt.ylabel("Value", size=16)

plt.title(
    "Left title",
    fontdict={"family": "serif", "color": "darkblue", "weight": "bold", "size": 16},
    loc="left",
)

plt.title(
    "Center title",
    fontdict={"family": "monospace", "color": "red", "weight": "bold", "size": 16},
    loc="center",
)

plt.title(
    "Right title",
    fontdict={"family": "fantasy", "color": "black", "weight": "bold", "size": 16},
    loc="right",
)

plt.grid(True)

plt.show()
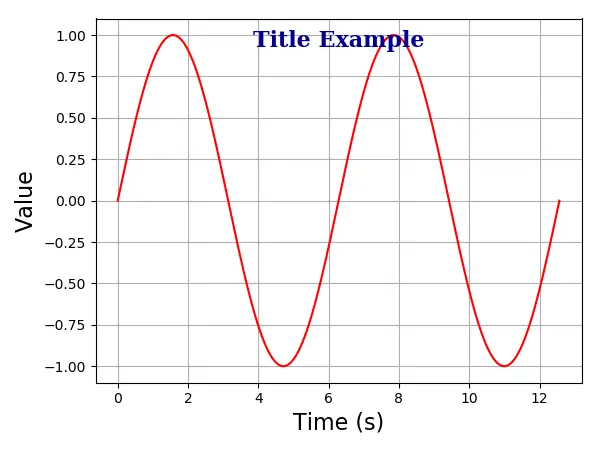
Matplotlib Axis Title Inside Plot
You could also place the title inside plot with the option of position=(m, n) or equivalently x = m, y = n. Here, m and n are numbers between 0.0 and 1.0.
The position (0, 0) is the lower-left corner of the plot, and the position (1.0, 1.0) are upper-right corner.
# -*- coding: utf-8 -*-
import numpy as np
import matplotlib.pyplot as plt

x = np.linspace(0, 4 * np.pi, 1000)
y = np.sin(x)

plt.figure(figsize=(6, 4.5))

plt.plot(x, y, "r")
plt.xlabel("Time (s)", size=16)
plt.ylabel("Value", size=16)

plt.title(
    "Title Example",
    position=(0.5, 0.9),
    fontdict={"family": "serif", "color": "darkblue", "weight": "bold", "size": 16},
)

plt.show()

Founder of DelftStack.com. Jinku has worked in the robotics and automotive industries for over 8 years. He sharpened his coding skills when he needed to do the automatic testing, data collection from remote servers and report creation from the endurance test. He is from an electrical/electronics engineering background but has expanded his interest to embedded electronics, embedded programming and front-/back-end programming.
LinkedIn Facebook