Matplotlib 튜토리얼-축 제목
Jinku Hu
2024년2월15일
Matplotlib
Matplotlib Axis
이 튜토리얼에서는 Matplotlib 의 축 제목에 대해 학습합니다.
Matplotlib 도끼 제목
통사론:
matplotlib.pyplot.title(label, fontdict=None, loc=None, **kwargs)
현재 축의 제목을 설정합니다.
** 매개 변수 **
| 이름 | 데이터 형식 | 기술 |
|---|---|---|
label |
str |
라벨 텍스트 |
fontdict |
dict |
가족, 색상, 무게 및 크기와 같은 레이블 텍스트 글꼴 사전 |
loc |
str |
제목의 위치입니다. {'center', 'left', 'right'}의 세 가지 옵션이 있으며 기본 옵션은 center 입니다. |
# -*- coding: utf-8 -*-
import numpy as np
import matplotlib.pyplot as plt
x = np.linspace(0, 4 * np.pi, 1000)
y = np.sin(x)
plt.figure(figsize=(4, 3))
plt.plot(x, y, "r")
plt.xlabel(
"Time (s)",
size=16,
)
plt.ylabel("Value", size=16)
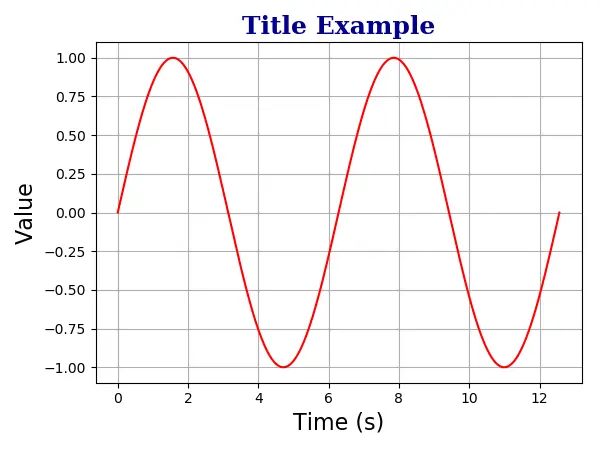
plt.title(
"Title Example",
fontdict={"family": "serif", "color": "darkblue", "weight": "bold", "size": 18},
)
plt.grid(True)
plt.show()
plt.title(
    "Title Example",
    fontdict={"family": "serif", "color": "darkblue", "weight": "bold", "size": 18},
)
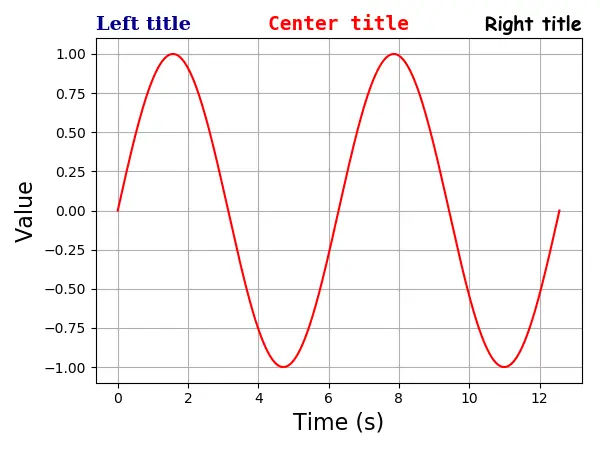
Matplotlib 축 여러 제목
하나의 축에는 ‘왼쪽’, ‘중심’및 ‘오른쪽’위치에 최대 3 개의 제목이있을 수 있습니다. 특정 타이틀의 위치는 loc 인수로 지정됩니다.
# -*- coding: utf-8 -*-
import numpy as np
import matplotlib.pyplot as plt

x = np.linspace(0, 4 * np.pi, 1000)
y = np.sin(x)

plt.figure(figsize=(8, 6))

plt.plot(x, y, "r")
plt.xlabel(
    "Time (s)",
    size=16,
)
plt.ylabel("Value", size=16)

plt.title(
    "Left title",
    fontdict={"family": "serif", "color": "darkblue", "weight": "bold", "size": 16},
    loc="left",
)

plt.title(
    "Center title",
    fontdict={"family": "monospace", "color": "red", "weight": "bold", "size": 16},
    loc="center",
)

plt.title(
    "Right title",
    fontdict={"family": "fantasy", "color": "black", "weight": "bold", "size": 16},
    loc="right",
)

plt.grid(True)

plt.show()
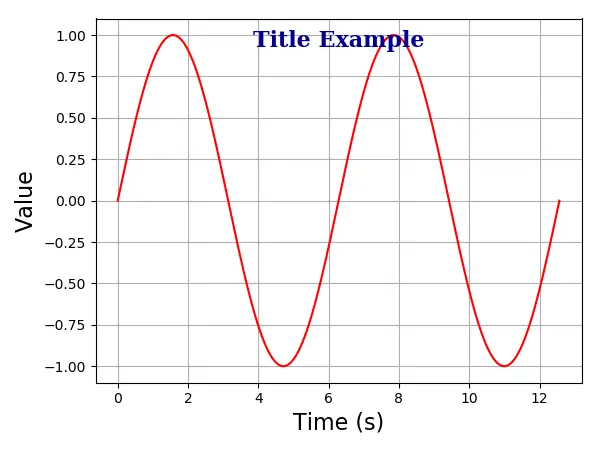
플롯 내 Matplotlib 축 제목
position = (m, n)옵션 또는 x = m, y = n 옵션을 사용하여 플롯 안에 제목을 배치 할 수도 있습니다. 여기서 m 과 n 은 0.0과 1.0 사이의 숫자입니다.
(0, 0)위치는 플롯의 왼쪽 아래 모서리이고(1.0, 1.0)위치는 오른쪽 위 모서리입니다.
# -*- coding: utf-8 -*-
import numpy as np
import matplotlib.pyplot as plt

x = np.linspace(0, 4 * np.pi, 1000)
y = np.sin(x)

plt.figure(figsize=(6, 4.5))

plt.plot(x, y, "r")
plt.xlabel("Time (s)", size=16)
plt.ylabel("Value", size=16)

plt.title(
    "Title Example",
    position=(0.5, 0.9),
    fontdict={"family": "serif", "color": "darkblue", "weight": "bold", "size": 16},
)

plt.show()
튜토리얼이 마음에 드시나요? DelftStack을 구독하세요 YouTube에서 저희가 더 많은 고품질 비디오 가이드를 제작할 수 있도록 지원해주세요. 구독하다
작가: Jinku Hu

Founder of DelftStack.com. Jinku has worked in the robotics and automotive industries for over 8 years. He sharpened his coding skills when he needed to do the automatic testing, data collection from remote servers and report creation from the endurance test. He is from an electrical/electronics engineering background but has expanded his interest to embedded electronics, embedded programming and front-/back-end programming.
LinkedIn Facebook