Tutoriel Matplotlib - Titre des axes
- Titre des axes dans Matplotlib
- Titres multiples de Matplotlib Axis
- Titre de l’axe Matplotlib à l’intérieur du tracé
Dans ce tutoriel, nous allons apprendre le titre des axes dans Matplotlib.
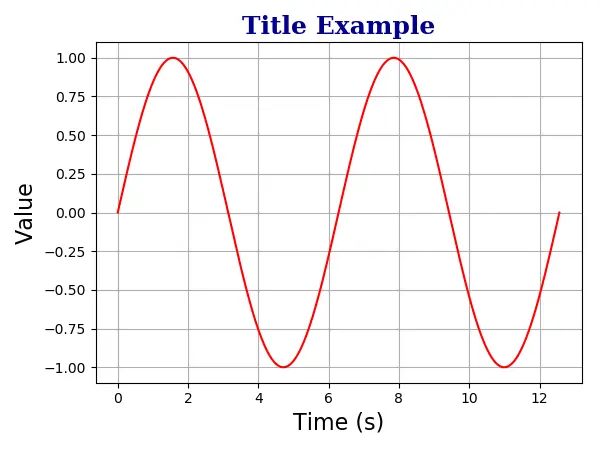
Titre des axes dans Matplotlib
La syntaxe:
matplotlib.pyplot.title(label, fontdict=None, loc=None, **kwargs)
Il définit un titre pour les axes courants.
**Paramètres
| Nom | Type de données | Description |
|---|---|---|
label |
str |
texte des étiquettes |
fontdict |
dict |
dictionnaire des polices de texte des étiquettes, comme la famille, la couleur, le poids et la taille |
loc |
str |
L’emplacement du titre. Il y a trois options, center, left, right et l’option par défaut est center. |
# -*- coding: utf-8 -*-
import numpy as np
import matplotlib.pyplot as plt

x = np.linspace(0, 4 * np.pi, 1000)
y = np.sin(x)

plt.figure(figsize=(4, 3))


plt.plot(x, y, "r")
plt.xlabel(
    "Time (s)",
    size=16,
)
plt.ylabel("Value", size=16)

plt.title(
    "Title Example",
    fontdict={"family": "serif", "color": "darkblue", "weight": "bold", "size": 18},
)

plt.grid(True)

plt.show()
plt.title(
    "Title Example",
    fontdict={"family": "serif", "color": "darkblue", "weight": "bold", "size": 18},
)
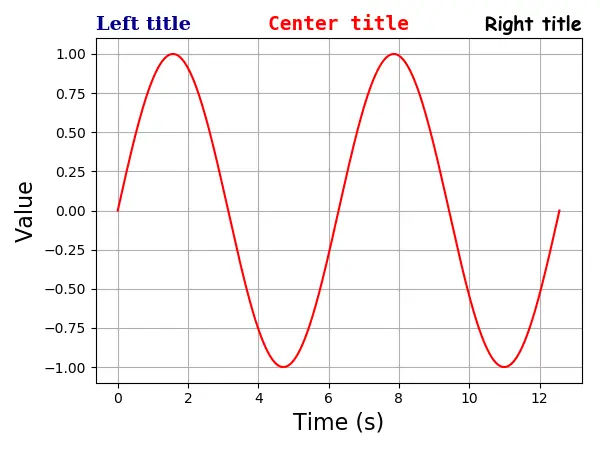
Titres multiples de Matplotlib Axis
Un axe pourrait avoir au plus trois titres qui sont en position left, center et right. La position du titre spécifique est spécifiée avec l’argument loc.
# -*- coding: utf-8 -*-
import numpy as np
import matplotlib.pyplot as plt

x = np.linspace(0, 4 * np.pi, 1000)
y = np.sin(x)

plt.figure(figsize=(8, 6))

plt.plot(x, y, "r")
plt.xlabel(
    "Time (s)",
    size=16,
)
plt.ylabel("Value", size=16)

plt.title(
    "Left title",
    fontdict={"family": "serif", "color": "darkblue", "weight": "bold", "size": 16},
    loc="left",
)

plt.title(
    "Center title",
    fontdict={"family": "monospace", "color": "red", "weight": "bold", "size": 16},
    loc="center",
)

plt.title(
    "Right title",
    fontdict={"family": "fantasy", "color": "black", "weight": "bold", "size": 16},
    loc="right",
)

plt.grid(True)

plt.show()
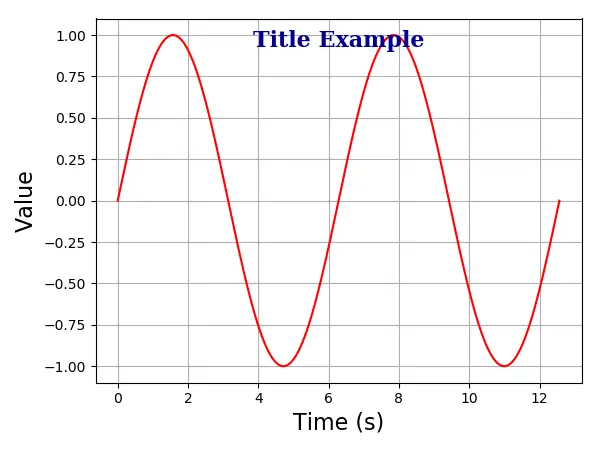
Titre de l’axe Matplotlib à l’intérieur du tracé
Vous pouvez aussi placer le titre à l’intérieur du tracé avec l’option positon=(m, n) ou de façon équivalente x = m, y = n. Ici, m et n sont des nombres entre 0,0 et 1,0.
La position (0, 0) est le coin inférieur gauche du tracé, et les positions (1.0, 1.0) sont les coins supérieur droit.
# -*- coding: utf-8 -*-
import numpy as np
import matplotlib.pyplot as plt

x = np.linspace(0, 4 * np.pi, 1000)
y = np.sin(x)

plt.figure(figsize=(6, 4.5))

plt.plot(x, y, "r")
plt.xlabel("Time (s)", size=16)
plt.ylabel("Value", size=16)

plt.title(
    "Title Example",
    position=(0.5, 0.9),
    fontdict={"family": "serif", "color": "darkblue", "weight": "bold", "size": 16},
)

plt.show()

Founder of DelftStack.com. Jinku has worked in the robotics and automotive industries for over 8 years. He sharpened his coding skills when he needed to do the automatic testing, data collection from remote servers and report creation from the endurance test. He is from an electrical/electronics engineering background but has expanded his interest to embedded electronics, embedded programming and front-/back-end programming.
LinkedIn Facebook