Tutorial de Matplotlib - Título de los ejes
- Título de los ejes de Matplotlib
- Eje Matplotlib Múltiples títulos
- Título del eje de Matplotlib dentro de la parcela
En este tutorial vamos a aprender sobre el título del eje en Matplotlib.
Título de los ejes de Matplotlib
Sintaxis:
matplotlib.pyplot.title(label, fontdict=None, loc=None, **kwargs)
Establece un título de los ejes actuales.
Parámetros
| Nombre | Tipo de datos | Descripción |
|---|---|---|
label |
str |
texto de la etiqueta |
fontdict |
dict |
etiquetar el diccionario de fuentes de texto, como la familia, el color, el peso y el tamaño |
loc |
str |
La ubicación del título. Tiene tres opciones, {'center', 'left', 'right'} y la opción por defecto es center |
# -*- coding: utf-8 -*-
import numpy as np
import matplotlib.pyplot as plt
x = np.linspace(0, 4 * np.pi, 1000)
y = np.sin(x)
plt.figure(figsize=(4, 3))
plt.plot(x, y, "r")
plt.xlabel(
"Time (s)",
size=16,
)
plt.ylabel("Value", size=16)
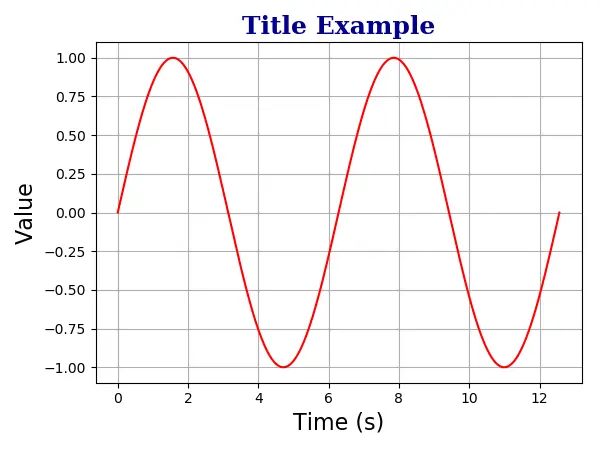
plt.title(
"Title Example",
fontdict={"family": "serif", "color": "darkblue", "weight": "bold", "size": 18},
)
plt.grid(True)
plt.show()
plt.title(
    "Title Example",
    fontdict={"family": "serif", "color": "darkblue", "weight": "bold", "size": 18},
)
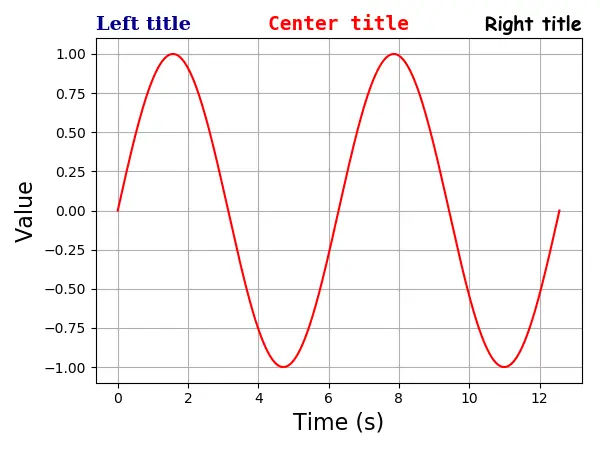
Eje Matplotlib Múltiples títulos
Un eje puede tener como máximo tres títulos que estén en la posición left, center y right. La posición del título específico se especifica con el argumento loc.
# -*- coding: utf-8 -*-
import numpy as np
import matplotlib.pyplot as plt

x = np.linspace(0, 4 * np.pi, 1000)
y = np.sin(x)

plt.figure(figsize=(8, 6))

plt.plot(x, y, "r")
plt.xlabel(
    "Time (s)",
    size=16,
)
plt.ylabel("Value", size=16)

plt.title(
    "Left title",
    fontdict={"family": "serif", "color": "darkblue", "weight": "bold", "size": 16},
    loc="left",
)

plt.title(
    "Center title",
    fontdict={"family": "monospace", "color": "red", "weight": "bold", "size": 16},
    loc="center",
)

plt.title(
    "Right title",
    fontdict={"family": "fantasy", "color": "black", "weight": "bold", "size": 16},
    loc="right",
)

plt.grid(True)

plt.show()
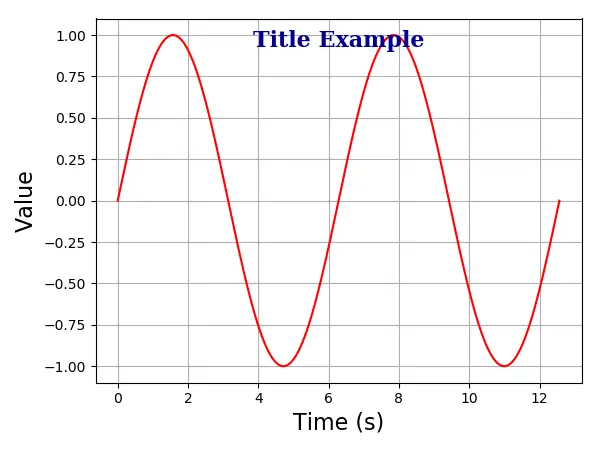
Título del eje de Matplotlib dentro de la parcela
También puedes colocar el título dentro de la trama con la opción de position=(m, n) o equivalente x = m, y = n. Aquí, m y n son números entre 0.0 y 1.0.
La posición (0, 0) es la esquina inferior izquierda del gráfico, y la posición (1.0, 1.0) es la esquina superior derecha.
# -*- coding: utf-8 -*-
import numpy as np
import matplotlib.pyplot as plt

x = np.linspace(0, 4 * np.pi, 1000)
y = np.sin(x)

plt.figure(figsize=(6, 4.5))

plt.plot(x, y, "r")
plt.xlabel("Time (s)", size=16)
plt.ylabel("Value", size=16)

plt.title(
    "Title Example",
    position=(0.5, 0.9),
    fontdict={"family": "serif", "color": "darkblue", "weight": "bold", "size": 16},
)

plt.show()

Founder of DelftStack.com. Jinku has worked in the robotics and automotive industries for over 8 years. He sharpened his coding skills when he needed to do the automatic testing, data collection from remote servers and report creation from the endurance test. He is from an electrical/electronics engineering background but has expanded his interest to embedded electronics, embedded programming and front-/back-end programming.
LinkedIn Facebook