Matplotlib 教程 - 座標軸標題
Jinku Hu
2023年1月30日
Matplotlib
Matplotlib Axis
在本教程中,我們將學習 Matplotlib 中的座標軸標題。
Matplotlib 座標軸標題
matplotlib.pyplot.title(label, fontdict=None, loc=None, **kwargs)
它用來設定當前軸的標題。
引數
| 名稱 | 資料型別 | 描述 |
|---|---|---|
label |
str |
標籤文字 |
fontdict |
dict |
標籤文字字型字典,例如字型系列、顏色、粗細和大小 |
loc |
str |
標題的位置。它具有三個選項,{'center', 'left', 'right'}。預設選項是 center |
# -*- coding: utf-8 -*-
import numpy as np
import matplotlib.pyplot as plt
x = np.linspace(0, 4 * np.pi, 1000)
y = np.sin(x)
plt.figure(figsize=(4, 3))
plt.plot(x, y, "r")
plt.xlabel(
"Time (s)",
size=16,
)
plt.ylabel("Value", size=16)
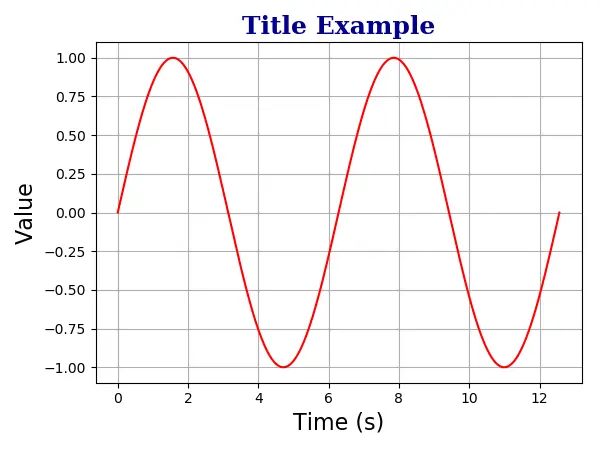
plt.title(
"Title Example",
fontdict={"family": "serif", "color": "darkblue", "weight": "bold", "size": 18},
)
plt.grid(True)
plt.show()
plt.title(
    "Title Example",
    fontdict={"family": "serif", "color": "darkblue", "weight": "bold", "size": 18},
)
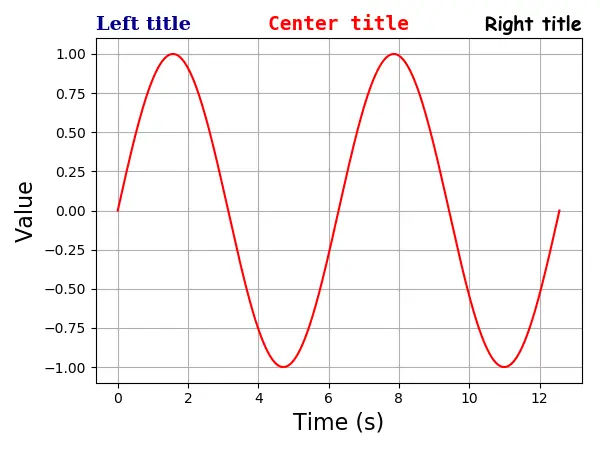
座標軸上的多個標題
一個軸最多可以包含三個標題 left,center 和 right。特定標題的位置由 loc 引數指定。
# -*- coding: utf-8 -*-
import numpy as np
import matplotlib.pyplot as plt

x = np.linspace(0, 4 * np.pi, 1000)
y = np.sin(x)

plt.figure(figsize=(8, 6))

plt.plot(x, y, "r")
plt.xlabel(
    "Time (s)",
    size=16,
)
plt.ylabel("Value", size=16)

plt.title(
    "Left title",
    fontdict={"family": "serif", "color": "darkblue", "weight": "bold", "size": 16},
    loc="left",
)

plt.title(
    "Center title",
    fontdict={"family": "monospace", "color": "red", "weight": "bold", "size": 16},
    loc="center",
)

plt.title(
    "Right title",
    fontdict={"family": "fantasy", "color": "black", "weight": "bold", "size": 16},
    loc="right",
)

plt.grid(True)

plt.show()
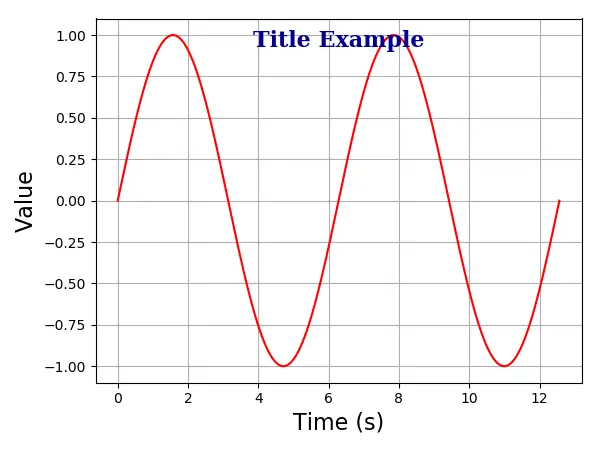
將座標軸標題放置在繪圖內部
你還可以使用 positon=(m, n) 或等效選項 x = m, y = n 將標題放置在繪圖內。在這裡,m 和 n 是介於 0.0 和 1.0 之間的數字。
位置 (0, 0) 是圖的左下角,位置 (1.0, 1.0) 是右上角。
# -*- coding: utf-8 -*-
import numpy as np
import matplotlib.pyplot as plt

x = np.linspace(0, 4 * np.pi, 1000)
y = np.sin(x)

plt.figure(figsize=(6, 4.5))

plt.plot(x, y, "r")
plt.xlabel("Time (s)", size=16)
plt.ylabel("Value", size=16)

plt.title(
    "Title Example",
    position=(0.5, 0.9),
    fontdict={"family": "serif", "color": "darkblue", "weight": "bold", "size": 16},
)

plt.show()
Enjoying our tutorials? Subscribe to DelftStack on YouTube to support us in creating more high-quality video guides. Subscribe
作者: Jinku Hu
