How to Perform Piecewise Regression in R

The Piecewise Regression is used when there are clear breakpoints in data.
This tutorial demonstrates how to perform piecewise regression in R.
Piecewise Regression in R
When there are clear breakpoints in data, the regression which will work will be the piecewise regression. The piecewise regression is the step-by-step process as demonstrated below:
-
Create the data frame.
-
Fit the linear regression model for the data. We can do it using the
lm()method. -
Fit the Piecewise Regression Model. The
segmented()method is used from thesegmentedpackage to fit the piecewise regression model. -
Visualize the final piecewise regression model using the
plot()method.
Now let’s try an example using the above steps. See example:
#Step 1
#create the DataFrame
data<-read.table(text="
Year    Stopped
2015    973
2016    1025
2017    1151
2018    1384
2019    4507
2020    15557
", header=T, sep="")

#first six rows of the data frame
head(data)


#Step2
#fit the simple linear regression model
dput(names(data))
q.lm <- lm(log(Stopped) ~ Year, data)
summary(q.lm)


#Step3
#fit the piecewise regression model to original model,
#estimating a breakpoint at x=14
install.packages('segmented')
library(segmented)

o <- segmented(q.lm, seg.Z = ~Year, psi = 2018)

# view the summary
summary(o)


#Step4
# visulize the piecewise regression model
plot(o)
points(log(Stopped) ~ Year, data)
The code above creates a piecewise regression model for the persons who stopped studies during different years. The code has a few outputs, which are described below:
The Output for Step 1:
  Year Stopped
1 2015     973
2 2016    1025
3 2017    1151
4 2018    1384
5 2019    4507
6 2020   15557
It shows the head of the data.
The Output for Step 2:
Call:
lm(formula = log(Stopped) ~ Year, data = data)

Residuals:
       1        2        3        4        5        6
 0.50759  0.03146 -0.38079 -0.72463 -0.07216  0.63853

Coefficients:
              Estimate Std. Error t value Pr(>|t|)
(Intercept) -1057.9257   279.3081  -3.788   0.0193 *
Year            0.5282     0.1384   3.815   0.0189 *
---
Signif. codes:  0 '***' 0.001 '**' 0.01 '*' 0.05 '.' 0.1 ' ' 1

Residual standard error: 0.5791 on 4 degrees of freedom
Multiple R-squared:  0.7844,	Adjusted R-squared:  0.7305
F-statistic: 14.56 on 1 and 4 DF,  p-value: 0.01886
This shows the summary for the linear regression model.
The Output for Step 3:
***Regression Model with Segmented Relationship(s)***

Call:
segmented.lm(obj = q.lm, seg.Z = ~Year, psi = 2018)

Estimated Break-Point(s):
              Est. St.Err
psi1.Year 2017.91  0.039

Meaningful coefficients of the linear terms:
              Estimate Std. Error t value Pr(>|t|)
(Intercept) -162.39260   35.56716  -4.566   0.0448 *
Year           0.08400    0.01764   4.761   0.0414 *
U1.Year        1.12577    0.02495  45.121       NA
---
Signif. codes:  0 '***' 0.001 '**' 0.01 '*' 0.05 '.' 0.1 ' ' 1

Residual standard error: 0.02495 on 2 degrees of freedom
Multiple R-Squared: 0.9998,  Adjusted R-squared: 0.9995

Boot restarting based on 6 samples. Last fit:
Convergence attained in 1 iterations (rel. change 3.7909e-16)
This fits the piecewise regression model and shows the summary for the model. The model detects a breakpoint in the year 2017.91.
The Output for Step 4:
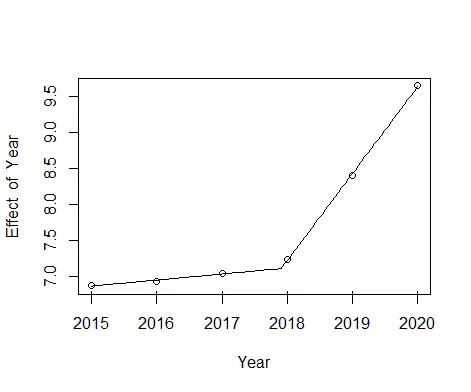
It visualizes the piecewise regression model. The plot shows that the piecewise regression model fits the given data quite well.

Sheeraz is a Doctorate fellow in Computer Science at Northwestern Polytechnical University, Xian, China. He has 7 years of Software Development experience in AI, Web, Database, and Desktop technologies. He writes tutorials in Java, PHP, Python, GoLang, R, etc., to help beginners learn the field of Computer Science.
LinkedIn Facebook