R 中的分段回归
Sheeraz Gul
2022年7月18日
R
R Regression

当数据中有明确的断点时,使用分段回归。本教程演示如何在 R 中执行分段回归。
R 中的分段回归
当数据中有明确的断点时,将起作用的回归将是分段回归。分段回归是一步一步的过程,如下所示:
-
创建数据框。
-
拟合数据的线性回归模型。我们可以使用
lm()方法来做到这一点。 -
拟合分段回归模型。
segmented()方法从segmented包中用于拟合分段回归模型。 -
使用
plot()方法可视化最终的分段回归模型。
现在让我们尝试使用上述步骤的示例。参见示例:
#Step 1
#create the DataFrame
data<-read.table(text="
Year    Stopped
2015    973
2016    1025
2017    1151
2018    1384
2019    4507
2020    15557
", header=T, sep="")

#first six rows of the data frame
head(data)


#Step2
#fit the simple linear regression model
dput(names(data))
q.lm <- lm(log(Stopped) ~ Year, data)
summary(q.lm)


#Step3
#fit the piecewise regression model to original model,
#estimating a breakpoint at x=14
install.packages('segmented')
library(segmented)

o <- segmented(q.lm, seg.Z = ~Year, psi = 2018)

# view the summary
summary(o)


#Step4
# visulize the piecewise regression model
plot(o)
points(log(Stopped) ~ Year, data)
上面的代码为在不同年份停止学习的人创建了一个分段回归模型。该代码有一些输出,如下所述:
第 1 步的输出:
  Year Stopped
1 2015     973
2 2016    1025
3 2017    1151
4 2018    1384
5 2019    4507
6 2020   15557
它显示了数据的头部。
第 2 步的输出:
Call:
lm(formula = log(Stopped) ~ Year, data = data)

Residuals:
       1        2        3        4        5        6
 0.50759  0.03146 -0.38079 -0.72463 -0.07216  0.63853

Coefficients:
              Estimate Std. Error t value Pr(>|t|)
(Intercept) -1057.9257   279.3081  -3.788   0.0193 *
Year            0.5282     0.1384   3.815   0.0189 *
---
Signif. codes:  0 '***' 0.001 '**' 0.01 '*' 0.05 '.' 0.1 ' ' 1

Residual standard error: 0.5791 on 4 degrees of freedom
Multiple R-squared:  0.7844,	Adjusted R-squared:  0.7305
F-statistic: 14.56 on 1 and 4 DF,  p-value: 0.01886
这显示了线性回归模型的摘要。
第 3 步的输出:
***Regression Model with Segmented Relationship(s)***

Call:
segmented.lm(obj = q.lm, seg.Z = ~Year, psi = 2018)

Estimated Break-Point(s):
              Est. St.Err
psi1.Year 2017.91  0.039

Meaningful coefficients of the linear terms:
              Estimate Std. Error t value Pr(>|t|)
(Intercept) -162.39260   35.56716  -4.566   0.0448 *
Year           0.08400    0.01764   4.761   0.0414 *
U1.Year        1.12577    0.02495  45.121       NA
---
Signif. codes:  0 '***' 0.001 '**' 0.01 '*' 0.05 '.' 0.1 ' ' 1

Residual standard error: 0.02495 on 2 degrees of freedom
Multiple R-Squared: 0.9998,  Adjusted R-squared: 0.9995

Boot restarting based on 6 samples. Last fit:
Convergence attained in 1 iterations (rel. change 3.7909e-16)
这适合分段回归模型并显示模型的摘要。该模型在 2017.91 年检测到一个断点。
第 4 步的输出:
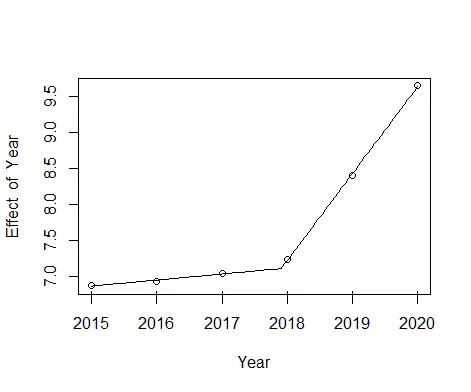
它可视化分段回归模型。该图显示分段回归模型非常适合给定数据。
Enjoying our tutorials? Subscribe to DelftStack on YouTube to support us in creating more high-quality video guides. Subscribe
作者: Sheeraz Gul

Sheeraz is a Doctorate fellow in Computer Science at Northwestern Polytechnical University, Xian, China. He has 7 years of Software Development experience in AI, Web, Database, and Desktop technologies. He writes tutorials in Java, PHP, Python, GoLang, R, etc., to help beginners learn the field of Computer Science.
LinkedIn Facebook