R의 조각별 회귀
조각별 회귀는 데이터에 명확한 중단점이 있을 때 사용됩니다. 이 튜토리얼은 R에서 조각별 회귀를 수행하는 방법을 보여줍니다.
R의 조각별 회귀
데이터에 명확한 중단점이 있는 경우 작동하는 회귀는 조각별 회귀가 됩니다. 조각별 회귀는 아래와 같이 단계별 프로세스입니다.
-
데이터 프레임을 생성합니다.
-
데이터에 대한 선형 회귀 모델을 피팅합니다.
lm()메서드를 사용하여 수행할 수 있습니다. -
조각별 회귀 모델을 피팅합니다.
segmented()메서드는segmented패키지에서 조각별 회귀 모델에 맞게 사용됩니다. -
plot()메서드를 사용하여 최종 조각별 회귀 모델을 시각화합니다.
이제 위의 단계를 사용하여 예제를 시도해 보겠습니다. 예를 참조하십시오.
#Step 1
#create the DataFrame
data<-read.table(text="
Year    Stopped
2015    973
2016    1025
2017    1151
2018    1384
2019    4507
2020    15557
", header=T, sep="")

#first six rows of the data frame
head(data)


#Step2
#fit the simple linear regression model
dput(names(data))
q.lm <- lm(log(Stopped) ~ Year, data)
summary(q.lm)


#Step3
#fit the piecewise regression model to original model,
#estimating a breakpoint at x=14
install.packages('segmented')
library(segmented)

o <- segmented(q.lm, seg.Z = ~Year, psi = 2018)

# view the summary
summary(o)


#Step4
# visulize the piecewise regression model
plot(o)
points(log(Stopped) ~ Year, data)
위의 코드는 여러 해 동안 연구를 중단한 사람들에 대한 조각별 회귀 모델을 생성합니다. 코드에는 아래에 설명된 몇 가지 출력이 있습니다.
1단계의 출력:
  Year Stopped
1 2015     973
2 2016    1025
3 2017    1151
4 2018    1384
5 2019    4507
6 2020   15557
데이터의 헤드를 보여줍니다.
2단계의 출력:
Call:
lm(formula = log(Stopped) ~ Year, data = data)

Residuals:
       1        2        3        4        5        6
 0.50759  0.03146 -0.38079 -0.72463 -0.07216  0.63853

Coefficients:
              Estimate Std. Error t value Pr(>|t|)
(Intercept) -1057.9257   279.3081  -3.788   0.0193 *
Year            0.5282     0.1384   3.815   0.0189 *
---
Signif. codes:  0 '***' 0.001 '**' 0.01 '*' 0.05 '.' 0.1 ' ' 1

Residual standard error: 0.5791 on 4 degrees of freedom
Multiple R-squared:  0.7844,	Adjusted R-squared:  0.7305
F-statistic: 14.56 on 1 and 4 DF,  p-value: 0.01886
이것은 선형 회귀 모델에 대한 요약을 보여줍니다.
3단계의 출력:
***Regression Model with Segmented Relationship(s)***

Call:
segmented.lm(obj = q.lm, seg.Z = ~Year, psi = 2018)

Estimated Break-Point(s):
              Est. St.Err
psi1.Year 2017.91  0.039

Meaningful coefficients of the linear terms:
              Estimate Std. Error t value Pr(>|t|)
(Intercept) -162.39260   35.56716  -4.566   0.0448 *
Year           0.08400    0.01764   4.761   0.0414 *
U1.Year        1.12577    0.02495  45.121       NA
---
Signif. codes:  0 '***' 0.001 '**' 0.01 '*' 0.05 '.' 0.1 ' ' 1

Residual standard error: 0.02495 on 2 degrees of freedom
Multiple R-Squared: 0.9998,  Adjusted R-squared: 0.9995

Boot restarting based on 6 samples. Last fit:
Convergence attained in 1 iterations (rel. change 3.7909e-16)
이것은 조각별 회귀 모델에 적합하고 모델에 대한 요약을 보여줍니다. 모델은 2017.91년에 중단점을 감지합니다.
4단계의 출력:
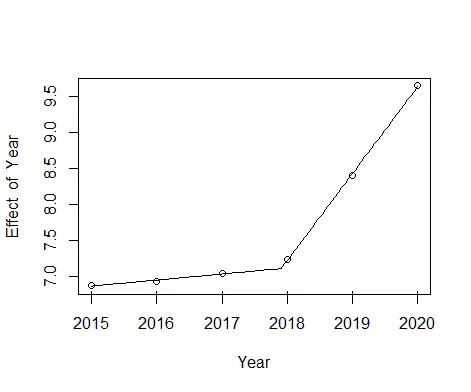
조각별 회귀 모델을 시각화합니다. 플롯은 조각별 회귀 모델이 주어진 데이터에 잘 맞는다는 것을 보여줍니다.

Sheeraz is a Doctorate fellow in Computer Science at Northwestern Polytechnical University, Xian, China. He has 7 years of Software Development experience in AI, Web, Database, and Desktop technologies. He writes tutorials in Java, PHP, Python, GoLang, R, etc., to help beginners learn the field of Computer Science.
LinkedIn Facebook