How to Do Exponential and Logarithmic Curve Fitting in Python
- Libraries and Modules Used for Logarithmic and Exponential Curve Fitting in Python
- the Logarithmic Curve Fitting
- the Exponential Curve Fitting
Curve fitting is a very efficient tool that is vastly used for analysis. The curve fitting method studies the relationship between independent variables that are also known as predictors and dependent variables known as response variables. This method aims to provide the most suitable model to fit a certain amount of data points.
There are two types of curve fitting:
- Logarithmic Curve Fitting
- Exponential Curve Fitting
In this tutorial, we will show you methods on how to do logarithmic curve fitting and exponential curve fitting in Python.
Libraries and Modules Used for Logarithmic and Exponential Curve Fitting in Python
Let’s discuss the possible libraries and modules you can use to execute programs.
the NumPy Library
Functions that we will be using from the NumPy library are the following.
array()- This function is used to create aNumPyarray that is a set of the same type of values and has index value in the form of tuples.log()- This function is more of a mathematical operation that helps calculate the natural logarithmic of a number. That number is a part of the elements of the input array.exp()- This function is also a mathematical operation used to calculate the exponential of elements present in an inputNumPyarray.polyfit()- This function helps in fitting any data in a polynomial function. It least squares a polynomial fit.
the Matplotlib Library
The Matplotlib library is mostly used for plotting in Python. This library is generally used for creating visualizations in Python. A module from this library known as the pyplot module is used in this tutorial.
The pyplot module of the Matplotlib library is an open-source module that helps make the Matplotlib library work like MATLAB. This module has many functions that help us carry out operations like creating a plotting area, creating labels on a plot, and more.
the Logarithmic Curve Fitting
As the name suggests, the logarithmic equation is plotted here. Let us directly jump into the code that will do logarithmic curve fitting in Python.
import numpy as np

x = np.array([5, 10, 15, 20, 25])
y = np.array([3, 6, 9, 12, 15])

log_x = np.log(x)
log_y = np.log(y)

coefficients = np.polyfit(log_x, y, 1)
print(coefficients)
Output:
[ 7.2647162 -9.64806344]
For plotting, follow this program.
import matplotlib.pyplot as plt

c = 7.26 * log_x - 9.64
plt.plot(log_x, y, "o")
plt.plot(log_x, c)
Output:
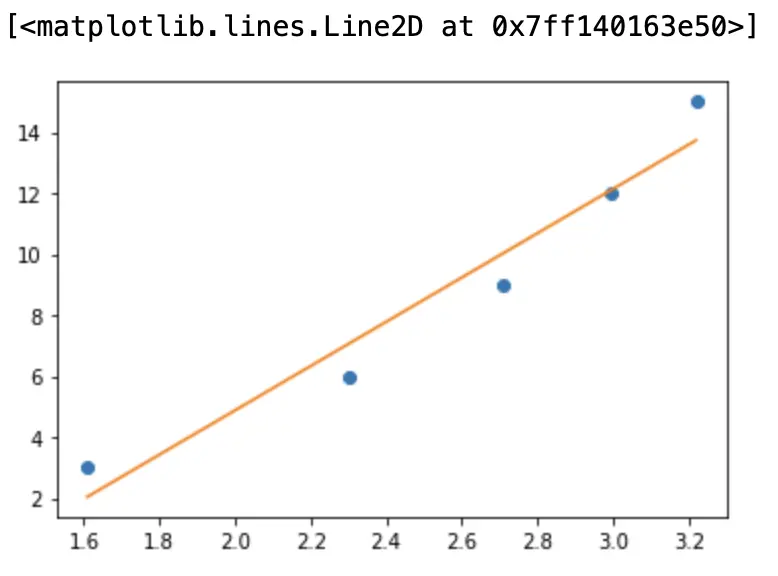
In the program above, we first import the necessary libraries. After that, we create two NumPy arrays as our primary data. Then, we calculate the logarithmic values of the elements in both arrays. We use the polyfit() function for both the logarithmic values of the x and y arrays. Using the polyfit() function, the coefficients for the logarithmic equation are returned.
- After getting the coefficients, we use those coefficients on the logarithmic equation for plotting the curve.
- Finally, we plot the graph using the
plot()function of thepyplotmodule of theMatplotliblibrary.
the Exponential Curve Fitting
As the name suggests, the exponential equation is plotted here. Let us directly jump into the code that will do exponential curve fitting in Python.
import numpy as np

a = np.array([6, 12, 18, 24, 30])
b = np.array([4, 8, 12, 16, 20])

log_a = np.log(a)
log_b = np.log(b)

coefficients = np.polyfit(a, log_b, 1)
print(coefficients)
Output:
[0.06520038 1.17018581]
For plotting, here’s a code snippet you can follow.
c = np.exp(1.17) * np.exp(0.06 * a)
plt.plot(a, b, "o")
plt.plot(a, c)
Output:
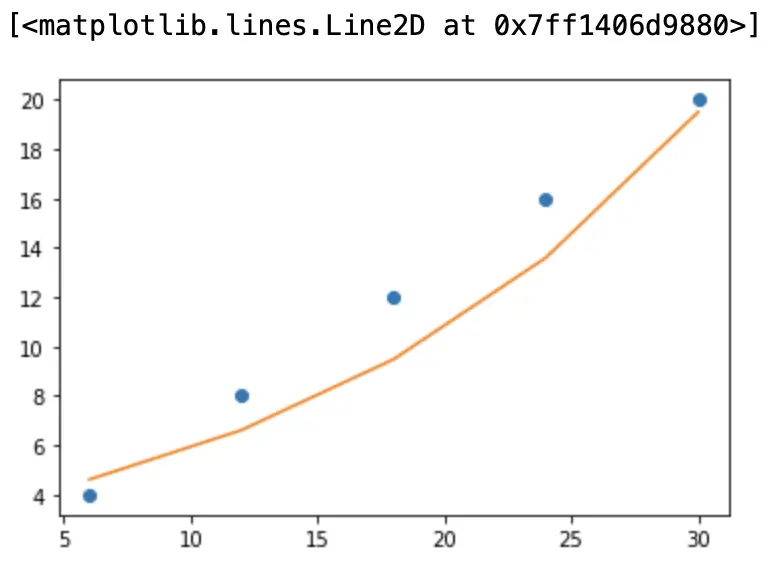
The same procedure is followed as we did in the logarithmic curve fitting. But here, the exponential function is used instead of the logarithmic function. So, the coefficients returned by the polyfit() function are passed in the exponential function equation.

Lakshay Kapoor is a final year B.Tech Computer Science student at Amity University Noida. He is familiar with programming languages and their real-world applications (Python/R/C++). Deeply interested in the area of Data Sciences and Machine Learning.
LinkedIn