Introduction to Useful Rolling Functions for GroupBy Object in Pandas
- Pandas Rolling vs. Rolling Window
- Rolling Window Feature
-
Syntax and Work Process of the
dataframe.rolling()Function - Useful Rolling Functions for GroupBy Object in Pandas
-
Use the
rolling().sum()Function for GroupBy Object in Pandas -
Use the
rolling().mean()Function for GroupBy Object in Pandas -
Use the
rolling().agg()Function on Multiple Columns for GroupBy Object in Pandas
Today, we will explore the difference between Pandas rolling and rolling window features. We will learn about the rolling window feature, its syntax, and its working process, leading us to various code examples demonstrating different rolling functions for the group by an object in Pandas.
Pandas Rolling vs. Rolling Window
Python has different data-centric libraries/packages, and Pandas is one of them. We use various useful functions of this library, and one of them is known as the rolling() function.
The dataframe.rolling() function performs complex calculations on the provided data. It also has a feature called a rolling window which we will see with an example in a moment in this section.
The rolling window feature primarily works with time series and signal processing data. We use it to perform calculations on the provided input data in a given object series.
For instance, assume that w is the window size and t is the time, so we can take a window size w at the time t to apply desired mathematical operations on the data. The window size w means w consecutive values at a time t; remember, all w values are weighted equally at a time t.
Rolling Window Feature
The rolling window means performing calculations on the provided data from the specified date to a rolling window shift. For instance, every staff member is on the 1-month rolling window, meaning s/he will receive their salary on the 1st of every month of each year.
The first salary is on January 1st, the second is on February 1st, and the third is on March 1st. This process will continue until every staff member receives their 12th salary on December 1st; this process will be repeated yearly.
So, we can say that the rolling window feature is relative to the first specified date and automatically moves forward with a given rolling window time. In our scenario, it is a 1-month rolling window.
Note that the rolling window is fixed size while the expanding window only has a fixed starting point; it can expand to incorporate data when available. You may read the difference here.
Syntax and Work Process of the dataframe.rolling() Function
The dataframe.rolling() function provides elements of a rolling window count. The concept of dataframe.rolling() is the same as a general rolling window where a user only specifies the weighted window size (w) once and does some operations.
The syntax of dataframe.rolling() is as follows:
DataFrame.rolling(window, min_periods=None, freq=None, center=False, win_type=None, on=None, axis=0, closed=None)
It can take the following parameters.
| Parameter | Description |
|---|---|
window |
It is the moving window’s size. It has several values/observations that are supposed to be used for calculations. |
min_periods |
It shows the least number of values/observations in a window, which must have a value; otherwise, the output would be NA. |
freq |
It is specified as a DateOffset object or string frequency which we use to confirm data before computing the statistic. |
center |
The center parameter will set all the labels at the window’s center. |
win_type |
It specifies the window type. |
on |
It is used for a data frame column where we are supposed to determine a rolling window instead of an index. |
closed |
It makes an interval closed on right, left, neither, or both endpoints. |
axis |
By default, it is 0, but it can be an int or string. |
Useful Rolling Functions for GroupBy Object in Pandas
We must have a data frame containing some sample data to learn the use of the rolling() function. We have a data frame as follows; you may also use the same.
Example Code:
import pandas as pd

n = range(0, 6)
id = ["a", "a", "a", "b", "b", "b"]
df = pd.DataFrame(zip(id, n), columns=["id", "n"])
df.set_index("id", inplace=True)
df
OUTPUT:
| id   | n    |
| ---- | ---- |
| a    | 0    |
| a    | 1    |
| a    | 2    |
| b    | 3    |
| b    | 4    |
| b    | 5    |
We imported the pandas library to work with the data frame in the above code snippet. Then, we used the range() function to get a sequence of numbers; by default, it starts from 0, ends before the specified number, and increments by 1.
We can change the default values of start, stop, and step parameters for range() function (if we want). Next, we have a list named id that we converted to a data frame using pd.DataFame(), which takes the data and a list of column names.
Here, the zip() function takes iterables that can be zero or more, map values from all the iterables, and return a single iterator object. The set_index() is used to make id as an index while the inplace attribute means changes will take effect within the data frame if it is set to True.
Use the rolling().sum() Function for GroupBy Object in Pandas
Example Code:
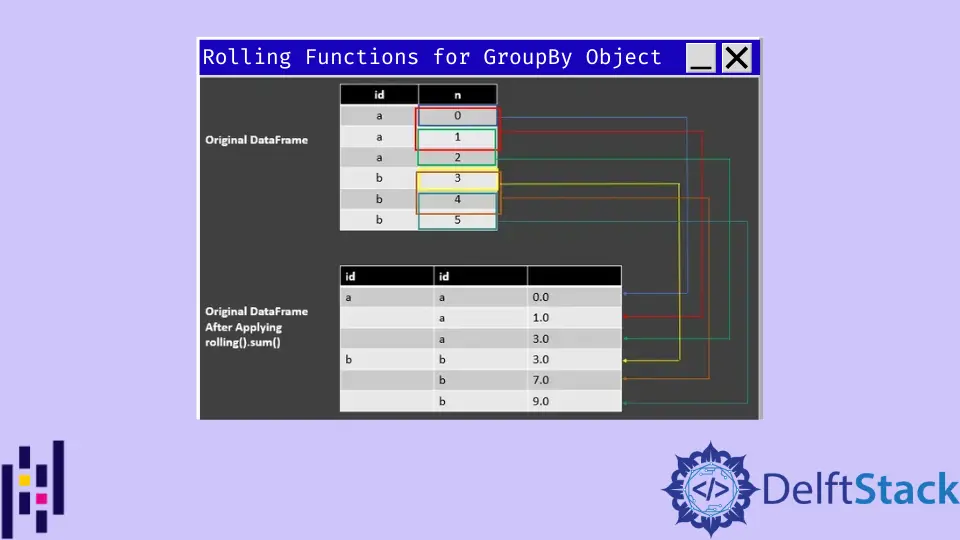
df_rolling_sum = df.groupby("id")["n"].rolling(2, min_periods=1).sum()
df_rolling_sum
OUTPUT:
| id   | id   |      |
| ---- | ---- | ---- |
| a    | a    | 0.0  |
|      | a    | 1.0  |
|      | a    | 3.0  |
| b    | b    | 3.0  |
|      | b    | 7.0  |
|      | b    | 9.0  |
Here, we used the groupby() function to create groups of particular values and perform operations on them. This function splits an object, applies the desired operations, and combines them to make a group.
The above line of codes do window length of 2 with min_periods=1 to perform sum on column n. See the following screenshot for understanding the output using rolling().sum().

Use the rolling().mean() Function for GroupBy Object in Pandas
Example Code:
df_rolling_mean = df.groupby("id")["n"].rolling(2, min_periods=1).mean()
df_rolling_mean
OUTPUT:
| id   | id   |      |
| ---- | ---- | ---- |
| a    | a    | 0.0  |
|      | a    | 0.5  |
|      | a    | 1.5  |
| b    | b    | 3.0  |
|      | b    | 3.5  |
|      | b    | 4.5  |
This example is similar to the previous code fence where we were using rolling().sum() except for the difference of mean(). Here, we are calculating the mean of two values in a window computed by the sum divided by the number of values.
See the following image to understand.
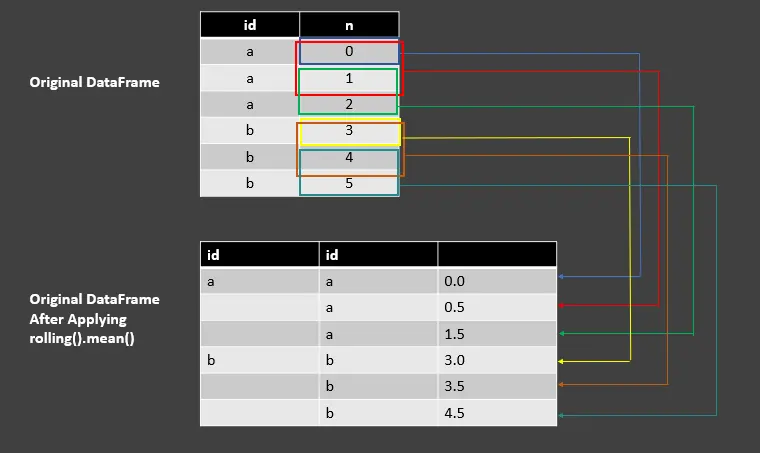
Remember, the first value of each group would be as it is in the output column because we don’t have any value before that, but if we omit the min_periods parameter, then we will have NaN. See the following example.
Example Code:
df_rolling_mean = df.groupby("id")["n"].rolling(2).mean()
df_rolling_mean
OUTPUT:
| id   | id   |      |
| ---- | ---- | ---- |
| a    | a    | NaN  |
|      | a    | 0.5  |
|      | a    | 1.5  |
| b    | b    | NaN  |
|      | b    | 3.5  |
|      | b    | 4.5  |
Use the rolling().agg() Function on Multiple Columns for GroupBy Object in Pandas
Example Code:
import pandas as pd

n1 = range(0, 6)
n2 = range(0, 6)
id = ["a", "a", "a", "b", "b", "b"]

df = pd.DataFrame(zip(id, n1, n1), columns=["id", "n1", "n2"])
df.set_index("id", inplace=True)

df_rolling_mean_sum = (
    df.groupby("id").rolling(2, min_periods=1).agg({"n1": "sum", "n2": "mean"})
)

print(df_rolling_mean_sum)
OUTPUT:
| id   | id   | n1   | n2   |
| ---- | ---- | ---- | ---- |
| a    | a    | 0.0  | 0.0  |
|      | a    | 1.0  | 0.5  |
|      | a    | 3.0  | 1.5  |
| b    | b    | 3.0  | 3.0  |
|      | b    | 7.0  | 3.5  |
|      | b    | 9.0  | 4.5  |
Here, we have two columns, n1 and n2, for which we use the agg() method to apply sum on n1 and mean on n2 (as given in the above output).
Use the DataFrame.cumsum() Function to Get the Rolling Sum for GroupBy Object in Pandas
Now, assume that we want to have a rolling sum as follows:
id n sum
a  0 0
a  1 1
a  2 3
b  3 3
b  4 7
b  5 12
Instead of the following:
id n sum
a  0 0.0
a  1 1.0
a  2 3.0
b  3 3.0
b  4 7.0
b  5 9.0
How can we do that? For that, we can use DataFrame.cumsum() as follows:
Example Code:
import pandas as pd

n = range(0, 6)
id = ["a", "a", "a", "b", "b", "b"]
df = pd.DataFrame(zip(id, n), columns=["id", "n"])
df.set_index("id", inplace=True)

df_cumsum = df.groupby("id").n.cumsum()
df_cumsum
OUTPUT:
| id   |      |
| ---- | ---- |
| a    | 0    |
| a    | 1    |
| a    | 3    |
| b    | 3    |
| b    | 7    |
| b    | 12   |
We can achieve the above output by using DataFrame.cumsum() method that returns a cumulative summation over the DataFrame or Series axis.