How to Calculate the Mean of a Grouped Data in Pandas
-
Use
groupby.mean()to Calculate the Mean of a Single Column in Pandas -
Use
groupby.mean()to Calculate the Mean of Multiple Columns in Pandas -
Use the
agg()Method to Calculate the Mean of a Grouped Data in Pandas

Pandas is an open-source data analysis library in Python. It provides many built-in methods to perform operations on numerical data.
groupby() is one of the methods available in Pandas that divides the data into multiple groups according to some criteria. After that, we can apply different methods to the grouped data like count(), mean(), etc.
This tutorial will demonstrate finding the mean of a grouped data using the groupby.mean() method in Pandas.
Use groupby.mean() to Calculate the Mean of a Single Column in Pandas
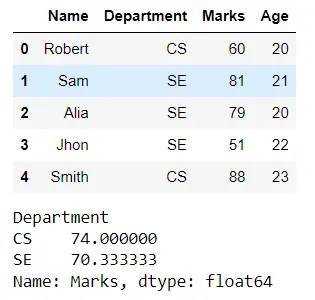
Here, we have students’ data in the Pandas dataframe object with data grouped based on the department. We will have two groups for two departments.
Then we will calculate the average marks of students of each group or department through the groupby.mean() method on a single column, i.e., Marks. In the output, we will get the average marks of the students of the CS and SE departments.
Example Code:
# Python 3.x
import pandas as pd

df = pd.DataFrame(
    {
        "Name": ["Robert", "Sam", "Alia", "Jhon", "Smith"],
        "Department": ["CS", "SE", "SE", "SE", "CS"],
        "Marks": [60, 81, 79, 51, 88],
        "Age": [20, 21, 20, 22, 23],
    }
)
display(df)
df.groupby("Department")["Marks"].mean()
Output:
Use groupby.mean() to Calculate the Mean of Multiple Columns in Pandas
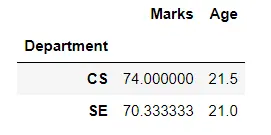
We can also take the mean of multiple columns simultaneously after grouping the data by providing the names of all the problems for which we want to calculate the mean. In the following code, we split the data according to the department and then calculated students’ average Marks and Age.
Example Code:
# Python 3.x
import pandas as pd

df = pd.DataFrame(
    {
        "Name": ["Robert", "Sam", "Alia", "Jhon", "Smith"],
        "Department": ["CS", "SE", "SE", "SE", "CS"],
        "Marks": [60, 81, 79, 51, 88],
        "Age": [20, 21, 20, 22, 23],
    }
)
display(df)
df.groupby("Department")["Marks", "Age"].mean()
Output:
Use the agg() Method to Calculate the Mean of a Grouped Data in Pandas
Alternatively, we can also use the agg() method to calculate the mean on a group by the object. We will pass mean as an argument to the agg() method.
Example Code:
# Python 3.x
import pandas as pd

df = pd.DataFrame(
    {
        "Name": ["Robert", "Sam", "Alia", "Jhon", "Smith"],
        "Department": ["CS", "SE", "SE", "SE", "CS"],
        "Marks": [60, 81, 79, 51, 88],
        "Age": [20, 21, 20, 22, 23],
    }
)
display(df)
df.groupby("Department")["Marks"].agg("mean")
Output:
---output.webp)

I am Fariba Laiq from Pakistan. An android app developer, technical content writer, and coding instructor. Writing has always been one of my passions. I love to learn, implement and convey my knowledge to others.
LinkedIn