How to Set Marker Size of Scatter Plot in Matplotlib
-
Understanding the
sArgument - Setting Uniform Marker Size
- Customizing Marker Sizes Based on Data
- Using Colormaps to Enhance Marker Sizes
- Conclusion
- FAQ
Visualizing data effectively is a key aspect of data analysis, and scatter plots are among the most popular methods for doing this. In Python, Matplotlib is the go-to library for creating a variety of plots, including scatter plots. One of the most crucial elements in a scatter plot is the size of the markers, which can greatly influence how your data is perceived. The s keyword argument in the scatter() function allows you to control the size of these markers, making it an essential tool for anyone looking to enhance their visualizations.
In this article, we will guide you through the process of setting marker sizes in Matplotlib scatter plots. We will cover various methods to adjust marker sizes, ensuring that you can tailor your scatter plots to effectively communicate your data’s story. Whether you’re a beginner or an experienced user, understanding how to manipulate marker sizes can elevate your data visualization game.
Understanding the s Argument
The s argument in the scatter() function is used to specify the size of the markers in your scatter plot. This argument can accept a single value, which will apply the same size to all markers, or an array of values, which allows for individual sizes for each point. The size is typically specified in points^2, meaning that if you set s=100, the size of each marker will be 10x10 points. This flexibility can help you highlight specific data points or categories effectively.
Here’s a simple example to illustrate this concept.
import matplotlib.pyplot as plt

x = [1, 2, 3, 4, 5]
y = [2, 3, 5, 7, 11]
sizes = [20, 50, 80, 200, 500]

plt.scatter(x, y, s=sizes)
plt.title('Scatter Plot with Varying Marker Sizes')
plt.xlabel('X-axis')
plt.ylabel('Y-axis')
plt.show()
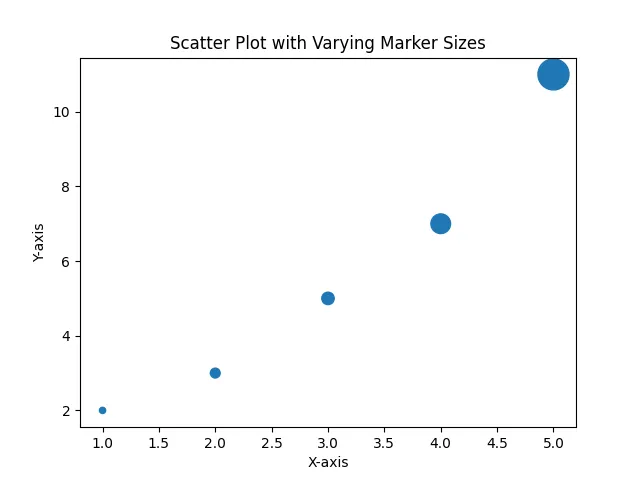
In this example, we create a scatter plot with five points, each having a different marker size specified by the sizes list. The sizes array contains values that determine the area of each marker, allowing for a clear visual distinction between the points. This makes it easier to analyze the data and draw insights.
Setting Uniform Marker Size
If you prefer to have all markers in your scatter plot the same size, you can simply assign a single value to the s argument. This is particularly useful when you want to maintain a consistent look across your plot.
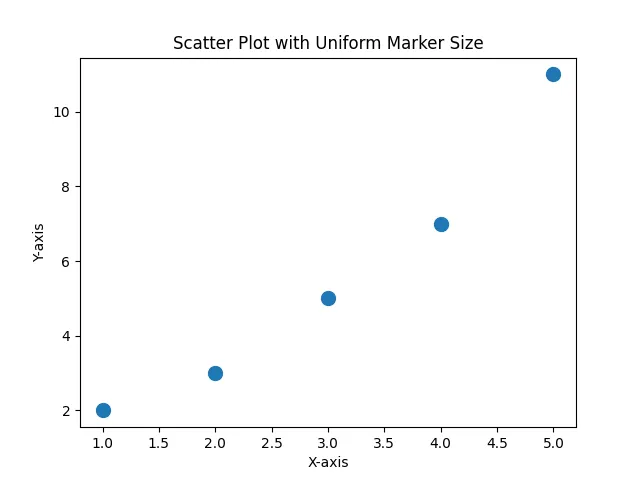
Here’s how to set a uniform marker size:
import matplotlib.pyplot as plt

x = [1, 2, 3, 4, 5]
y = [2, 3, 5, 7, 11]

plt.scatter(x, y, s=100)
plt.title('Scatter Plot with Uniform Marker Size')
plt.xlabel('X-axis')
plt.ylabel('Y-axis')
plt.show()
In this example, every marker in the scatter plot is set to a size of 100 points^2. This uniformity can make your plot look cleaner and more professional, especially when presenting data to an audience.
Output:
Customizing Marker Sizes Based on Data
Sometimes, you may want to vary the marker sizes based on certain data attributes. This can be particularly useful in multi-dimensional datasets where the size of the marker can represent another variable.
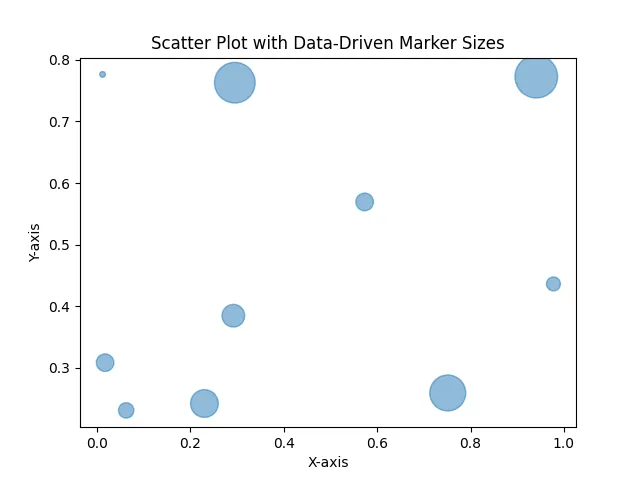
Here’s an example of how to customize marker sizes based on data values:
import matplotlib.pyplot as plt
import numpy as np

x = np.random.rand(10)
y = np.random.rand(10)
sizes = np.random.rand(10) * 1000  # Random sizes

plt.scatter(x, y, s=sizes, alpha=0.5)
plt.title('Scatter Plot with Data-Driven Marker Sizes')
plt.xlabel('X-axis')
plt.ylabel('Y-axis')
plt.show()
In this snippet, we generate random data for both x and y coordinates, as well as random sizes for the markers. The alpha parameter adds some transparency to the markers, making it easier to see overlapping points. This method allows you to convey additional information through the size of the markers, enhancing the overall effectiveness of your visualization.
Output:
Using Colormaps to Enhance Marker Sizes
Another effective way to enhance your scatter plot is by combining marker sizes with colormaps. This method allows you to represent another variable through colors while varying the sizes simultaneously.
Here’s how to implement this:
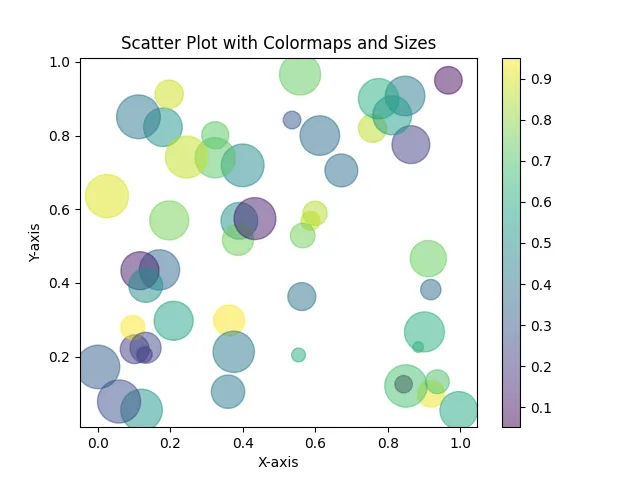
import matplotlib.pyplot as plt
import numpy as np

x = np.random.rand(50)
y = np.random.rand(50)
sizes = np.random.rand(50) * 1000
colors = np.random.rand(50)

plt.scatter(x, y, s=sizes, c=colors, alpha=0.5, cmap='viridis')
plt.colorbar()  # Show color scale
plt.title('Scatter Plot with Colormaps and Sizes')
plt.xlabel('X-axis')
plt.ylabel('Y-axis')
plt.show()
In this example, we generate random data for x, y, sizes, and colors. The c parameter takes the color values, and we use the cmap argument to specify the colormap. The colorbar() function adds a scale to the plot, which helps in understanding the color representation. This method not only makes your scatter plot more informative but also visually appealing.
Output:
Conclusion
Setting marker sizes in scatter plots using Matplotlib is a straightforward yet powerful feature that can significantly enhance your data visualizations. Whether you choose to apply uniform sizes, customize them based on data, or even incorporate colormaps, understanding how to manipulate the s argument allows you to convey your data’s story more effectively. By mastering these techniques, you’ll be well on your way to creating compelling and insightful visualizations that engage your audience.
FAQ
-
How do I change the marker size in a scatter plot?
You can change the marker size by using thesargument in thescatter()function. -
Can I have different marker sizes for each point?
Yes, by passing an array of sizes to thesargument, you can assign different sizes to each marker. -
What units are used for marker sizes in Matplotlib?
The marker sizes are specified in points^2. -
How do I make markers transparent in a scatter plot?
You can use thealphaparameter in thescatter()function to set the transparency level. -
Can I combine marker sizes with colors in a scatter plot?
Yes, you can use thecparameter for colors and thesparameter for sizes together to create more informative visualizations.

Suraj Joshi is a backend software engineer at Matrice.ai.
LinkedIn