Matplotlib에서 산점도의 마커 크기를 설정하는 방법
Suraj Joshi
2023년1월30일
Matplotlib
Matplotlib Scatter
산점도에서 마커의 크기는scatter()함수의s 키워드 인수에 의해 제어됩니다. 여기서s는 스칼라 또는 배열입니다.
scatter()함수의s 키워드 인수
scatter 함수의 구문:
matplotlib.pyplot.scatter(
    x,
    y,
    s=None,
    c="b",
    marker="o",
    cmap=None,
    norm=None,
    vmin=None,
    vmax=None,
    alpha=None,
    linewidths=None,
    faceted=True,
    verts=None,
    hold=None,
    **kwargs
)
여기서s는markersize를 설정하기위한 스칼라 또는x 및y와 같은 길이의 배열입니다. 기본 마커 크기는rcParams['lines.markersize']**2입니다. 문서에 따르면s는 마커 크기**2입니다.
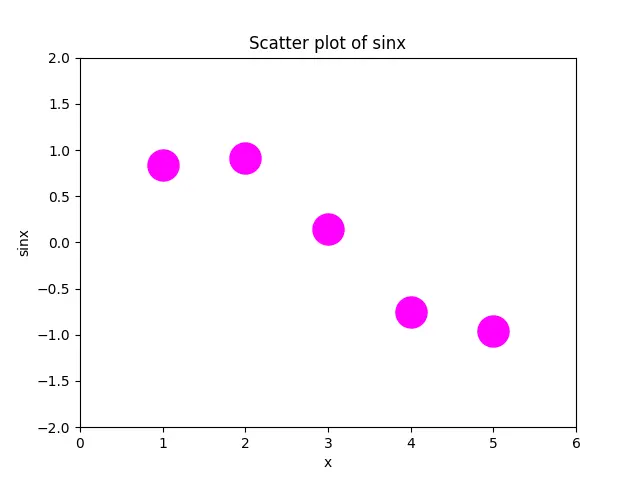
모든 포인트의 동일한 마커 크기 설정
import numpy as np
import matplotlib.pyplot as plt

x = [1, 2, 3, 4, 5]
y = np.sin(x)

plt.scatter(x, y, s=500, c="magenta")

plt.title("Scatter plot of sinx")
plt.xlabel("x")
plt.ylabel("sinx")
plt.xlim(0, 6)
plt.ylim(-2, 2)
plt.show()
포인트의 마커 크기를 불균일하게 증가
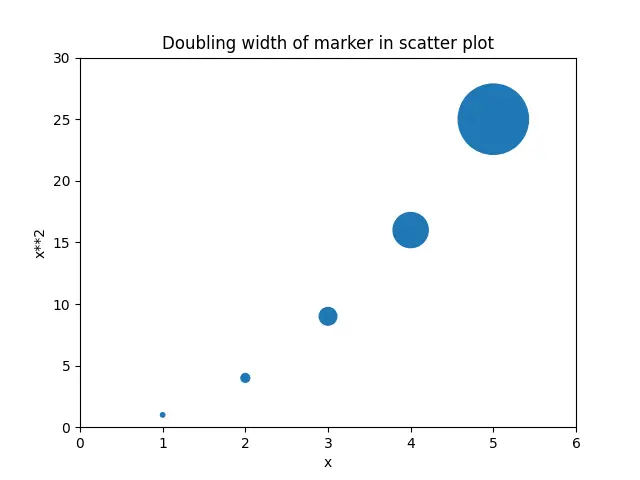
마커 너비의 두 배
마커의 ‘너비’(또는 ‘높이’)를 두 배로 늘리려면A = W*H => (2W)*(2H)= 4A와 같이s를4만큼 늘려야합니다.
import matplotlib.pyplot as plt

x = [1, 2, 3, 4, 5]
y = [a ** 2 for a in x]
s = [10 * 4 ** n for n in range(len(x))]
plt.scatter(x, y, s=s)
plt.title("Doubling width of marker in scatter plot")
plt.xlabel("x")
plt.ylabel("x**2")
plt.xlim(0, 6)
plt.ylim(0, 30)
plt.show()
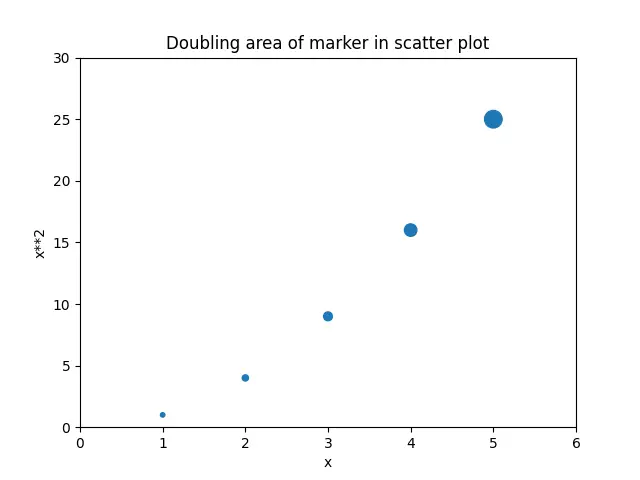
마커 면적의 두 배
마커의 면적을 두 배로 늘리기 위해 ‘영역’을 2만큼 늘려 마커 크기가 ‘영역’과 선형으로 스케일됩니다.
import matplotlib.pyplot as plt

x = [1, 2, 3, 4, 5]
y = [a ** 2 for a in x]
s = [10 * 2 ** n for n in range(len(x))]
plt.scatter(x, y, s=s)
plt.title("Doubling area of marker in scatter plot")
plt.xlabel("x")
plt.ylabel("x**2")
plt.xlim(0, 6)
plt.ylim(0, 30)
plt.show()
plot 메소드에서 크기를 제어하는markersize 매개 변수
import matplotlib.pyplot as plt

x = [1, 2, 3, 4, 5]
y = [0] * len(x)

plt.plot(x, y, "bo", markersize=10)
plt.show()
여기서 원의 영역은markersize 매개 변수에 의해 제어됩니다.
튜토리얼이 마음에 드시나요? DelftStack을 구독하세요 YouTube에서 저희가 더 많은 고품질 비디오 가이드를 제작할 수 있도록 지원해주세요. 구독하다
작가: Suraj Joshi

Suraj Joshi is a backend software engineer at Matrice.ai.
LinkedIn