如何在 Matplotlib 中设置散点图的标记大小
Suraj Joshi
2023年1月30日
Matplotlib
Matplotlib Scatter
Matplotlib 中散点图中标记的大小由函数 scatter() 的 s 关键字参数控制,其中 s 是标量或数组。
函数 scatter() 的 s 关键字参数
scatter 函数的语法:
matplotlib.pyplot.scatter(
    x,
    y,
    s=None,
    c="b",
    marker="o",
    cmap=None,
    norm=None,
    vmin=None,
    vmax=None,
    alpha=None,
    linewidths=None,
    faceted=True,
    verts=None,
    hold=None,
    **kwargs
)
其中,s 是标量或长度与 x 和 y 相同的数组,用于设置 markersize。默认标记大小为 rcParams['lines.markersize'] ** 2。根据文档,s 是标记大小的平方。
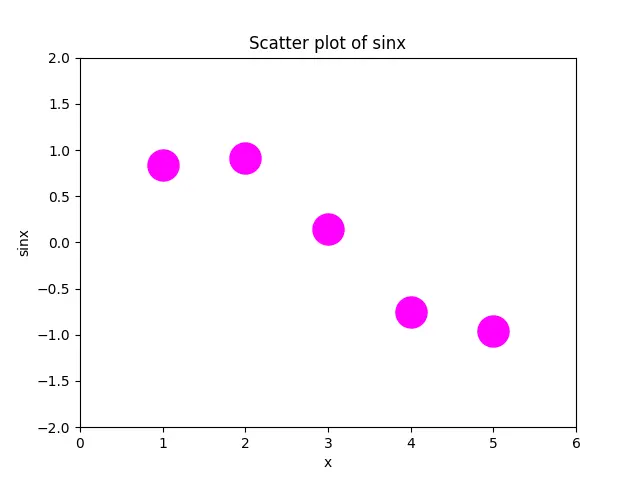
为所有点设置相同的标记大小
import numpy as np
import matplotlib.pyplot as plt

x = [1, 2, 3, 4, 5]
y = np.sin(x)

plt.scatter(x, y, s=500, c="magenta")

plt.title("Scatter plot of sinx")
plt.xlabel("x")
plt.ylabel("sinx")
plt.xlim(0, 6)
plt.ylim(-2, 2)
plt.show()
不一致地增加点的标记大小
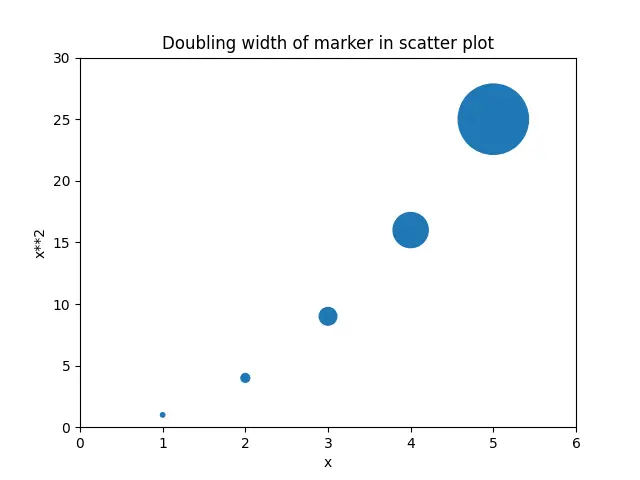
标记宽度加倍
为了使标记的宽度(或高度)加倍,我们需要将 s 增加 4 倍,因为 A = W*H => (2W)*(2H)= 4A。
import matplotlib.pyplot as plt

x = [1, 2, 3, 4, 5]
y = [a ** 2 for a in x]
s = [10 * 4 ** n for n in range(len(x))]
plt.scatter(x, y, s=s)
plt.title("Doubling width of marker in scatter plot")
plt.xlabel("x")
plt.ylabel("x**2")
plt.xlim(0, 6)
plt.ylim(0, 30)
plt.show()
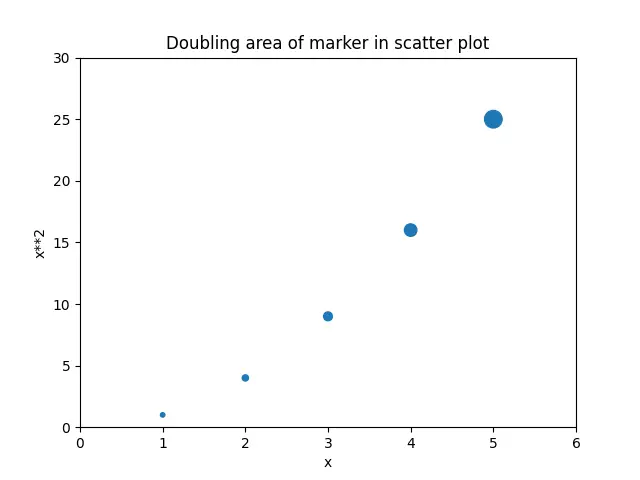
标记面积加倍
要使标记的面积增加一倍,我们将 area 增加 2 倍,以便标记尺寸随 area 线性缩放。
import matplotlib.pyplot as plt

x = [1, 2, 3, 4, 5]
y = [a ** 2 for a in x]
s = [10 * 2 ** n for n in range(len(x))]
plt.scatter(x, y, s=s)
plt.title("Doubling area of marker in scatter plot")
plt.xlabel("x")
plt.ylabel("x**2")
plt.xlim(0, 6)
plt.ylim(0, 30)
plt.show()
Matplotlib plot 方法中用 markersize 参数以控制大小
import matplotlib.pyplot as plt

x = [1, 2, 3, 4, 5]
y = [0] * len(x)

plt.plot(x, y, "bo", markersize=10)
plt.show()
在这里,圆的面积由 markersize 参数控制。
Enjoying our tutorials? Subscribe to DelftStack on YouTube to support us in creating more high-quality video guides. Subscribe
作者: Suraj Joshi

Suraj Joshi is a backend software engineer at Matrice.ai.
LinkedIn