如何在 Matplotlib 中用线连接散点图点
Suraj Joshi
2023年1月30日
Matplotlib
Matplotlib Scatter

我们可以在调用了 scatter()和 plot()之后,通过调用 show()来连接直线的散点,并使用 line 和 point 属性调用 plot(),然后使用关键字 zorder 来指定绘图顺序。
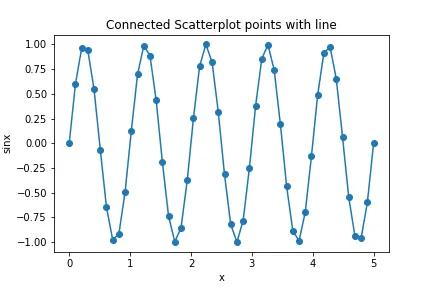
在调用 scatter()和 plot()之后调用 show()
matplotlib.pyplot.scatter(x, y),其中 x 是 x 坐标序列,而 y 是 y 坐标序列会创建点的散点图。要按顺序连接这些散点图的点,请调用 matplotlib.pyplot.plot(x, y),使 x 和 y 与传递给 scatter() 函数的点相同。
import numpy as np
import matplotlib.pyplot as plt

x = np.linspace(0, 5, 50)
y = np.sin(2 * np.pi * x)

plt.scatter(x, y)
plt.plot(x, y)
plt.title("Connected Scatterplot points with line")
plt.xlabel("x")
plt.ylabel("sinx")
plt.show()
figure.tight_layout()
输出:

具有线型属性的 matplotlib.pyplot.plot() 函数
我们也可以通过仅调用 matplotlib.pyplot.plot() 函数以及 linestyle 属性来将 scatterplot 点与直线连接起来。
import numpy as np
import matplotlib.pyplot as plt

x = np.linspace(0, 5, 50)
y = np.sin(2 * np.pi * x)

plt.plot(x, y, linestyle="solid", color="blue")
plt.title("Connected Scatterplot points with line")
plt.xlabel("x")
plt.ylabel("sinx")
plt.show()
figure.tight_layout()
输出:
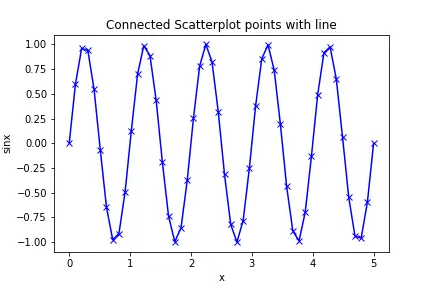
同样,我们也可以尝试其他不同的 linestyles。
import numpy as np
import matplotlib.pyplot as plt

x = np.linspace(0, 5, 50)
y = np.sin(2 * np.pi * x)

plt.plot(x, y, "xb-")
plt.title("Connected Scatterplot points with line")
plt.xlabel("x")
plt.ylabel("sinx")
plt.show()
输出:
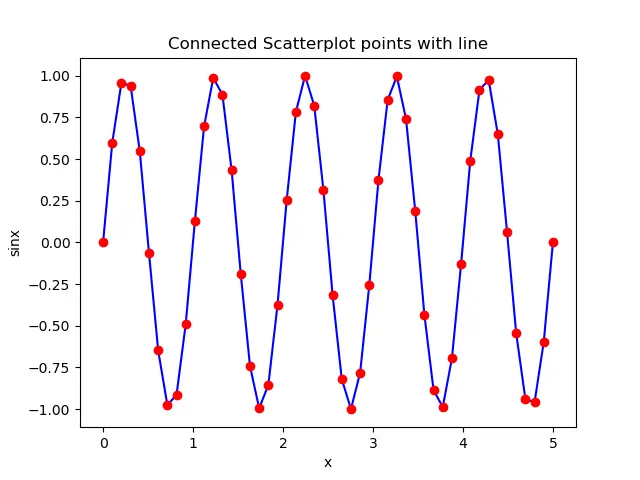
关键字 zorder 更改 Matplotlib 绘图顺序
我们可以使用关键字 zorder 来设置 Matplotlib 图中的绘制顺序。我们将为 plot 和 scatter 分配不同的顺序,然后颠倒顺序以显示不同的绘制顺序行为。
import numpy as np
import matplotlib.pyplot as plt

x = np.linspace(0, 5, 50)
y = np.sin(2 * np.pi * x)

plt.scatter(x, y, color="r", zorder=1)
plt.plot(x, y, color="b", zorder=2)

plt.title("Connected Scatterplot points with line")
plt.xlabel("x")
plt.ylabel("sinx")

plt.show()
输出:

plot()的顺序为 2,大于 scatter()的顺序,因此,散点图位于线图的顶部。
如果我们颠倒顺序,则线图将位于散点图的顶部。
import numpy as np
import matplotlib.pyplot as plt

x = np.linspace(0, 5, 50)
y = np.sin(2 * np.pi * x)

plt.scatter(x, y, color="r", zorder=2)
plt.plot(x, y, color="b", zorder=1)

plt.title("Connected Scatterplot points with line")
plt.xlabel("x")
plt.ylabel("sinx")

plt.show()
输出:
Enjoying our tutorials? Subscribe to DelftStack on YouTube to support us in creating more high-quality video guides. Subscribe
作者: Suraj Joshi

Suraj Joshi is a backend software engineer at Matrice.ai.
LinkedIn