How to Connect Scatterplot Points With Line in Matplotlib
-
Call
show()After Calling Bothscatter()andplot() -
matplotlib.pyplot.plot()Function With thelinestyleAttribute -
Keyword
zorderto Change the Drawing Order

We can connect scatter plot points with a line by calling show() after we have called both scatter() and plot(), calling plot() with the line and point attributes, and using the keyword zorder to assign the drawing order.
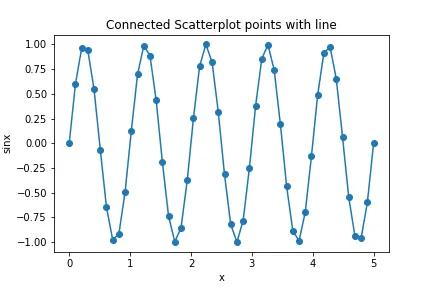
Call show() After Calling Both scatter() and plot()
matplotlib.pyplot.scatter(x, y) with x as a sequence of x-coordinates and y as a sequence of y-coordinates creates a scatter plot of points. To connect these points of scatter plot in order, call matplotlib.pyplot.plot(x, y) keeping x and y the same as ones passed into scatter() function.
import numpy as np
import matplotlib.pyplot as plt

x = np.linspace(0, 5, 50)
y = np.sin(2 * np.pi * x)

plt.scatter(x, y)
plt.plot(x, y)
plt.title("Connected Scatterplot points with line")
plt.xlabel("x")
plt.ylabel("sinx")
plt.show()
figure.tight_layout()
Output:

matplotlib.pyplot.plot() Function With the linestyle Attribute
We can also connect scatterplot points with line by just calling the matplotlib.pyplot.plot() function along with the linestyle attribute.
import numpy as np
import matplotlib.pyplot as plt

x = np.linspace(0, 5, 50)
y = np.sin(2 * np.pi * x)

plt.plot(x, y, linestyle="solid", color="blue")
plt.title("Connected Scatterplot points with line")
plt.xlabel("x")
plt.ylabel("sinx")
plt.show()
figure.tight_layout()
Output:
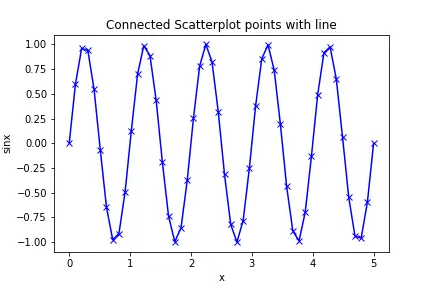
Similarly, we can try other different linestyles too
import numpy as np
import matplotlib.pyplot as plt

x = np.linspace(0, 5, 50)
y = np.sin(2 * np.pi * x)

plt.plot(x, y, "xb-")
plt.title("Connected Scatterplot points with line")
plt.xlabel("x")
plt.ylabel("sinx")
plt.show()
Output:
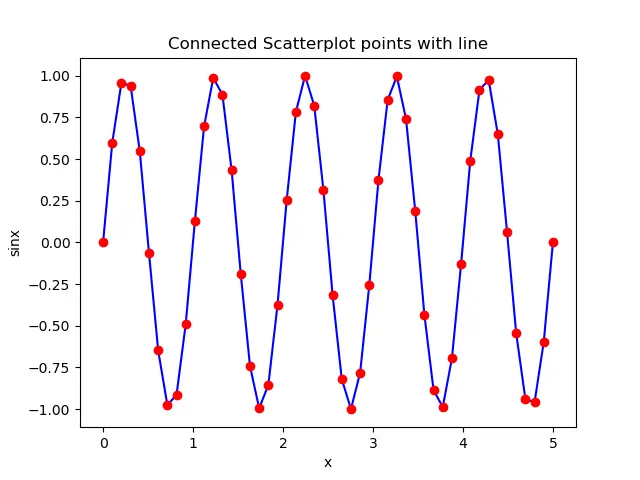
Keyword zorder to Change the Drawing Order
We can use the keyword zorder to set the drawing order in the figure. We will assign different orders to plot and scatter and then reverse the orders to show different drawing order behaviors.
import numpy as np
import matplotlib.pyplot as plt

x = np.linspace(0, 5, 50)
y = np.sin(2 * np.pi * x)

plt.scatter(x, y, color="r", zorder=1)
plt.plot(x, y, color="b", zorder=2)

plt.title("Connected Scatterplot points with line")
plt.xlabel("x")
plt.ylabel("sinx")

plt.show()
Output:

plot() has the order as 2, larger than the order of scatter(), therefore, the scatter plot is on top of the line plot.
If we reverse the order, then the line plot will be on top of the scatter plot.
import numpy as np
import matplotlib.pyplot as plt

x = np.linspace(0, 5, 50)
y = np.sin(2 * np.pi * x)

plt.scatter(x, y, color="r", zorder=2)
plt.plot(x, y, color="b", zorder=1)

plt.title("Connected Scatterplot points with line")
plt.xlabel("x")
plt.ylabel("sinx")

plt.show()
Output:

Suraj Joshi is a backend software engineer at Matrice.ai.
LinkedIn