How to Set Marker Size of Scatter Plot in Matplotlib
-
sKeyword Argument to Set Matplotlib Scatter Marker Size - Set the Same Scatter Marker Size of All Points in Matplotlib
- Increase Scatter Marker Size of Points Non-Uniformly in Matplotlib
-
markersizeParameter to Set Scatter Marker Size in MatplotlibplotFunction
The size of scatter markers in Matplotlib is specified by the s keyword argument of the function scatter(), where s is a scalar or an array.
s Keyword Argument to Set Matplotlib Scatter Marker Size
The Syntax of the scatter function:
matplotlib.pyplot.scatter(
    x,
    y,
    s=None,
    c="b",
    marker="o",
    cmap=None,
    norm=None,
    vmin=None,
    vmax=None,
    alpha=None,
    linewidths=None,
    faceted=True,
    verts=None,
    hold=None,
    **kwargs
)
Where, s is a scalar or an array of the same length as x and y, to set the scatter marker size. The default scatter marker size is rcParams['lines.markersize'] ** 2. According to documentation, s is the marker size in points2.
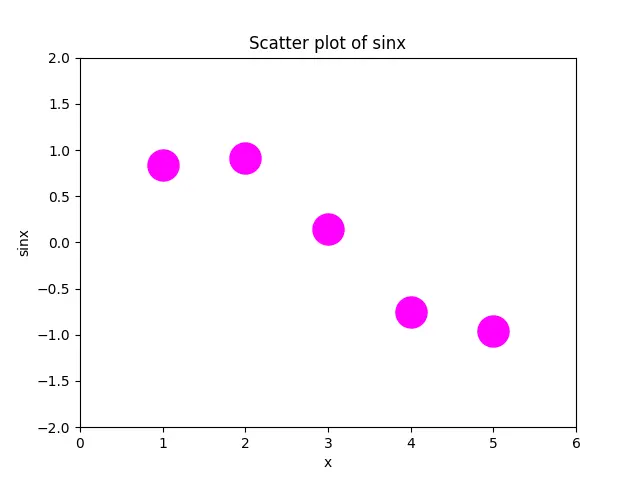
Set the Same Scatter Marker Size of All Points in Matplotlib
import numpy as np
import matplotlib.pyplot as plt

x = [1, 2, 3, 4, 5]
y = np.sin(x)

plt.scatter(x, y, s=500, c="magenta")

plt.title("Scatter plot of sinx")
plt.xlabel("x")
plt.ylabel("sinx")
plt.xlim(0, 6)
plt.ylim(-2, 2)
plt.show()
Increase Scatter Marker Size of Points Non-Uniformly in Matplotlib
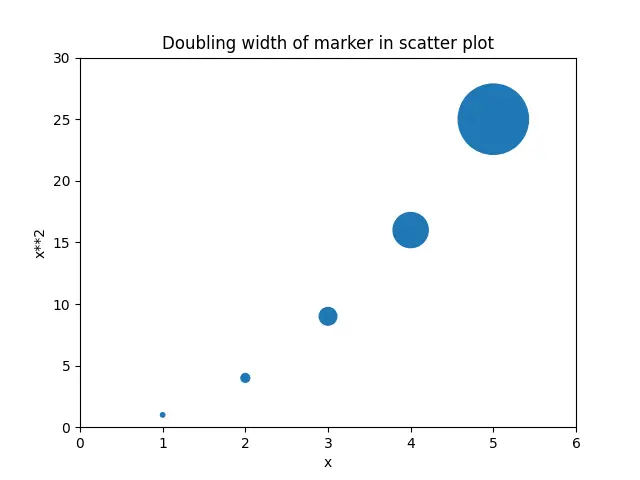
Double the Width of Matplotlib Scatter Marker
To double the width (or height) of the marker we need to increase s by a factor of 4 as A = W*H => (2W)*(2H)= 4A.
import matplotlib.pyplot as plt

x = [1, 2, 3, 4, 5]
y = [a ** 2 for a in x]
s = [10 * 4 ** n for n in range(len(x))]
plt.scatter(x, y, s=s)
plt.title("Doubling width of marker in scatter plot")
plt.xlabel("x")
plt.ylabel("x**2")
plt.xlim(0, 6)
plt.ylim(0, 30)
plt.show()
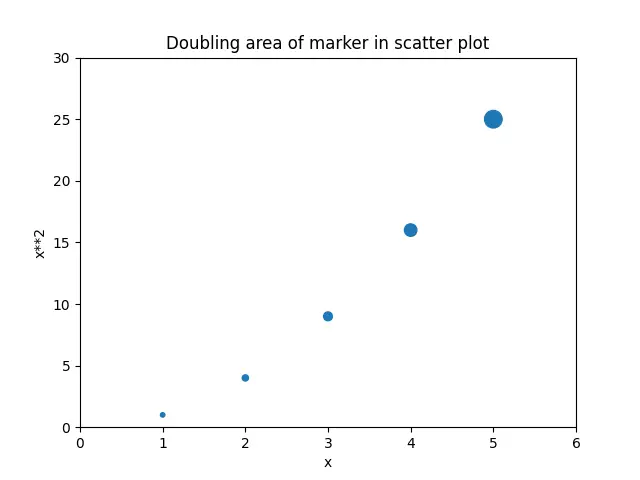
Double the Area of Matplotlib Scatter Marker
To double the area of the marker, we increase the area by a factor of 2, so the marker size scales linearly with the area.
import matplotlib.pyplot as plt

x = [1, 2, 3, 4, 5]
y = [a ** 2 for a in x]
s = [10 * 2 ** n for n in range(len(x))]
plt.scatter(x, y, s=s)
plt.title("Doubling area of marker in scatter plot")
plt.xlabel("x")
plt.ylabel("x**2")
plt.xlim(0, 6)
plt.ylim(0, 30)
plt.show()
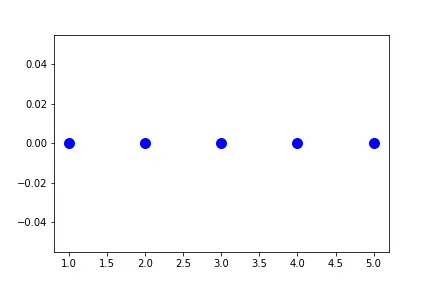
markersize Parameter to Set Scatter Marker Size in Matplotlib plot Function
import matplotlib.pyplot as plt

x = [1, 2, 3, 4, 5]
y = [0] * len(x)

plt.plot(x, y, "bo", markersize=10)
plt.show()
Here the area of the circle is controlled by the markersize parameter.

Suraj Joshi is a backend software engineer at Matrice.ai.
LinkedIn