How to Plot Mesh Surface in MATLAB
This tutorial will discuss creating the mesh surface plot using the mesh() function in Matlab.
Create Surface Plots Using the mesh() Function in MATLAB
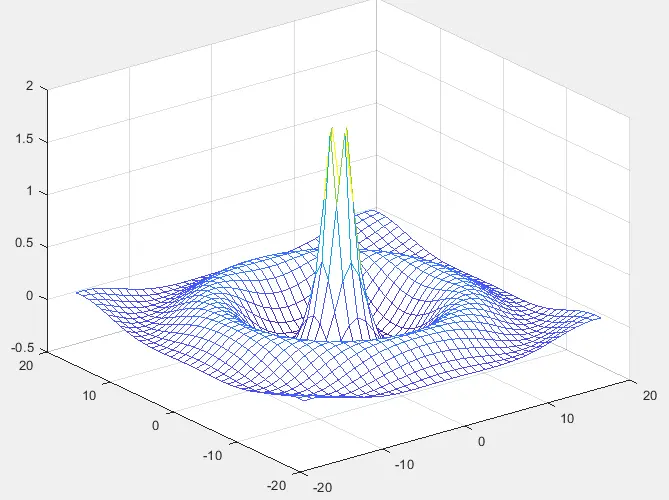
Matlab’s built-in function mesh() creates the surface plots on a 3D plane. We can pass the matrix inside the mesh() function as a function which we want to plot in the 3D plane. The mesh() function will plot the given matrix along the z-axis using the default value for the x-y coordinates. The x and y coordinates will be from the indices of the given matrix. The given matrix will be plotted on the z-axis as heights on a three-dimensional plane. For example, Let’s create a matrix Z and plot it on the surface plot using the mash() function in Matlab. See the code below.
[x,y] = meshgrid(-18:1:18);
r = sqrt(x.^2 + y.^2)/2;
z = cos(r)./r;
mesh(x,y,z)
Output:
Rather than using the default value for this matrix, we can create our own XY-plane to plot the given matrix. The surface plot using the mesh() function will have solid face color and no edge color. You can also specify the color of the mesh using the fourth argument inside the mesh() function. We can also set other properties like FaceAlpha, which is used to set the visibility of the surface.
By default, the visibility of the surfaces is 1. You can also create an object of the mesh function to use later and edit and change any other functions properties. You can use a meshgrid() function to create a mesh grid along with the x-y coordinates. The surface plot has been plotted according to colors, so we can also draw a color bar along with the surface plot to indicate which color corresponds to which value.
Let’s draw a color bar on the above plot. See the code below.
[x,y] = meshgrid(-18:1:18);
r = sqrt(x.^2 + y.^2)/2;
z = cos(r)./r;
mesh(x,y,z)
colorbar
Output:
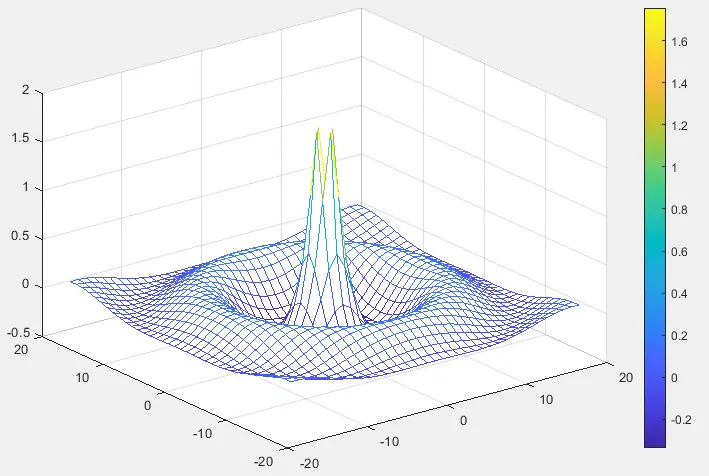
We can use the meshc() function to draw counters below the surface plot instead of the mesh() function. We can also use the meshz() function to draw curtains below the surface plot instead of the mesh() function. Inside a mesh surface plot, the colder color corresponds to a low value, and the hotter color corresponds to the maximum value.
We can also change the line style of the plot using the line style property. The default line style property is the solid line, but we can change it to dash solid or solid dashed or the dotted line. You can also use the surf() function instead of the mesh() function to plot surface plots.
The difference between the mesh() and surf() function is that when we use the mesh() function, the edge color will be solid, and there will be no face color, but if we use the surf() function, there will be no edge color and solid face color.
In the above plots, we can see that the plot is made up of multiple boxes with colored edges, but they don’t have color in the center, but if we use the surf() function, the boxes will be filled with color. We can also turn face coloring on in the mesh() function using the FaceColor property, and we can also turn face coloring off in the surf() function using the same property.
