How to Plot Color Map in MATLAB
-
Plot a Color Map Using the
mesh()Function in MATLAB -
Plot a Color Map Using the
meshc()Function in MATLAB -
Plot a Color Map Using the
meshz()Function in MATLAB -
Plot a Color Map Using the
surf()Function in MATLAB

In this tutorial, we will discuss how can we plot a color map using the mesh(), meshc(), meshz(), and surf() function in MATLAB.
Plot a Color Map Using the mesh() Function in MATLAB
To plot the given matrix’s color map, you can use the mesh() function, which plots the variable on a given x and y-axis. If the coordinates are not given, it will use the indices of the matrix as coordinates. The mesh() function plots a given matrix as heights on the given coordinate. To provide the coordinates as input to the mesh() function, you have to use the meshgrid() function to make a mesh of coordinates on which the given matrix will be plotted. See the code below.
a = 0:0.1:10;
z = [sin(a);sin(a)];
mesh(z)
colorbar
Output:
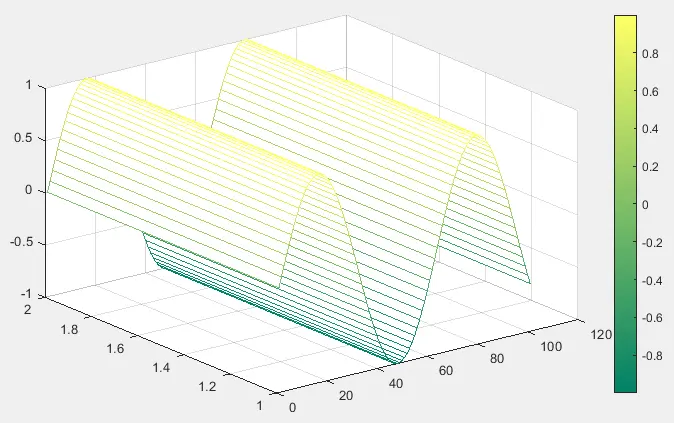
In the above code, we plotted the color map of a sine wave. The color map assigns the lowest value to the coldest color and the highest value to the hottest color. You can see in the figure, as the value of the sine wave increases, the color shifts from a colder region to a hotter region and vise versa. You can also show the color bar using the colorbar function. From the color bar, you can see which value is assigned to which color. You can also change the color map to your desired color range using the colormap function. For example, let’s plot the above sine wave on a summer color map. See the code below.
a = 0:0.1:10;
z = [sin(a);sin(a)];
mesh(z)
colormap summer
colorbar
Output:
Now, let’s plot a matrix on a given coordinate. First, we have to create a mesh grid using the meshgrid() function and then pass the coordinates along with the matrix to plot the given matrix on given coordinates. See the example code below.
a = 0:0.1:10;
b = 0:10;
[x,y] = meshgrid(a,b);
z = sin(x) + sin(y);
mesh(x,y,z)
colorbar
Output:
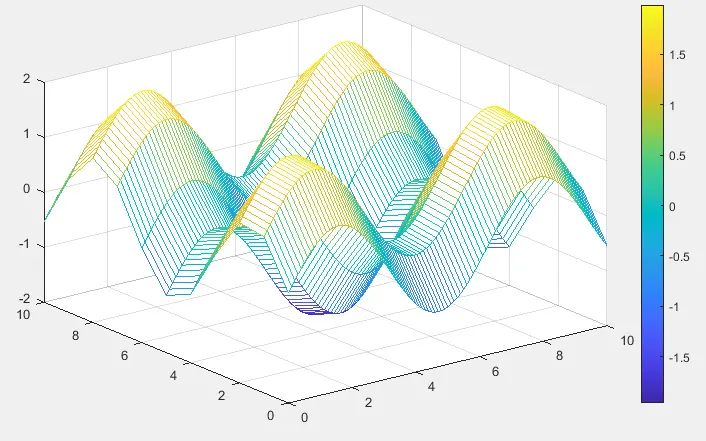
You can see that the x and y coordinates are exactly the same as the given coordinates in the above figure. You can plot the given matrix on any x and y coordinate. Now, let’s change this 3D plot into 2D with the help of the view() function. This function changes the view of the graph. Using this function, we can only see two coordinates. See the below code.
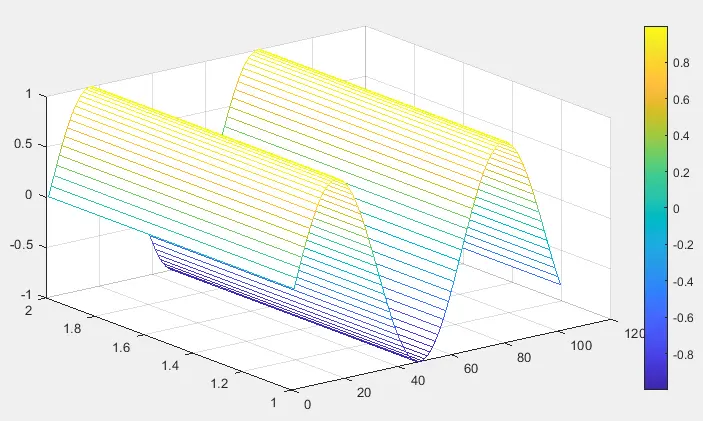
a = 0:0.1:30;
z = [sin(a); sin(a)];
mesh(z)
colorbar
view(2)
Output:
In the above code, we have plotted the sine wave and changed the plot from 3D to 2D using the view() function. You can see in the figure, as the value of the sine wave increases, the color shifts from a colder region to a hotter region and vise versa. You can see the color bar to check which value is assigned to which color. You can also change other mesh properties like the edge color using the EdgeColor property, line style using the LineColor property, face color using the FaceColor property, etc. For example, let’s change the face color to flat using the FaceColor property in the mesh() function. See the code below.
a = 0:0.1:10;
b = 0:10;
[x,y] = meshgrid(a,b);
z = sin(x) + sin(y);
mesh(x,y,z,'FaceColor','Flat')
colorbar
Output:
In the above code, we changed the face color of the mesh plot to flat, which means the surface of the plot will be flat, as shown in the above figure. Check this link for more information of the mesh() function and properties.
Plot a Color Map Using the meshc() Function in MATLAB
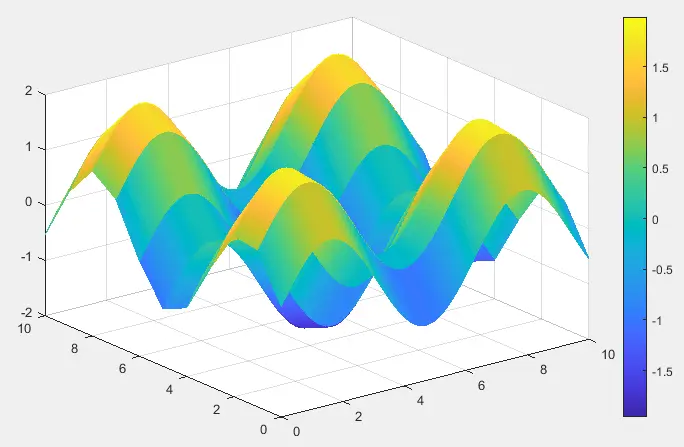
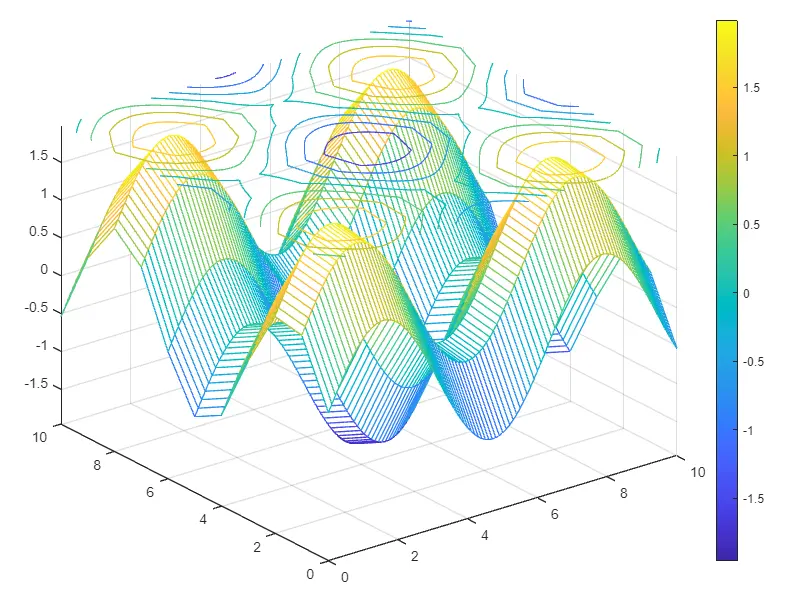
To plot the color map of the given matrix, you can use the meshc() function, which plots the color map of the variable on a given x and y-axis and adds the contour plot under the mesh plot. If the coordinates are not given, it will use the indices of the matrix as coordinates. The meshc() function plots a given matrix as heights on the given coordinate. To give the coordinates as input to the meshc() function, you have to use the meshgrid() function to make a mesh of coordinates on which the given matrix will be plotted. For example, let’s plot a matrix. See the code below.
a = 0:0.1:10;
b = 0:10;
[x,y] = meshgrid(a,b);
z = sin(x) + sin(y);
meshc(x,y,z)
colorbar
Output:
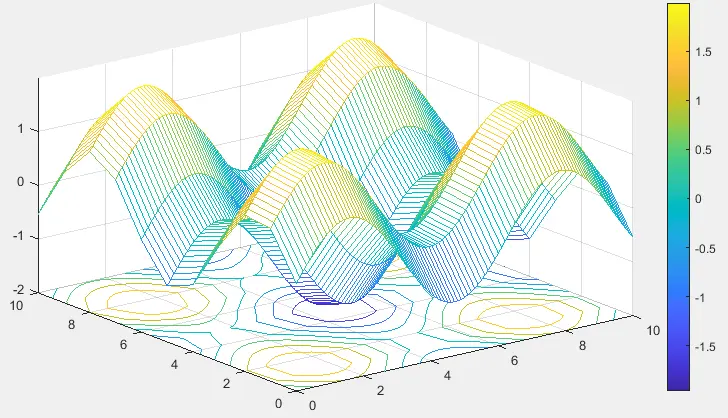
You can also change the color map to your desired color range using the colormap function. For example, let’s plot the above sine wave on a summer color map. See the code below.
a = 0:0.1:10;
b = 0:10;
[x,y] = meshgrid(a,b);
z = sin(x) + sin(y);
meshc(x,y,z)
colorbar
colormap winter
Output:
You can also change the edge color of the mesh and the edge color of the contour using the EdgeColor property in the meshc() function. See the below code.
a = 0:0.1:10;
b = 0:10;
[x,y] = meshgrid(a,b);
z = sin(x) + sin(y);
sc = meshc(x,y,z)
sc(1).EdgeColor = 'r';
sc(2).EdgeColor = 'b';
colorbar
Output:
In the above code, we change the edge color of the mesh plot to red and the edge color of the contour plot to blue. You can select any color you want from the available colors. You can also change the position of the contour plot in the figure. For example, let’s change the contour plot position and plot it on the z-axis using the Zlocation property. See the code below.
a = 0:0.1:10;
b = 0:10;
[x,y] = meshgrid(a,b);
z = sin(x) + sin(y);
sc = meshc(x,y,z)
sc(2).ZLocation = 'zmax';
colorbar
Output:
Check this link for more information about the meshc() function.
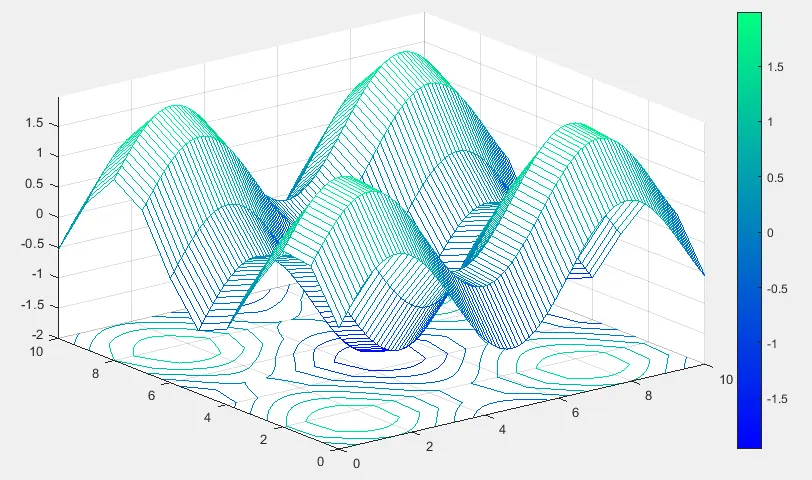
Plot a Color Map Using the meshz() Function in MATLAB
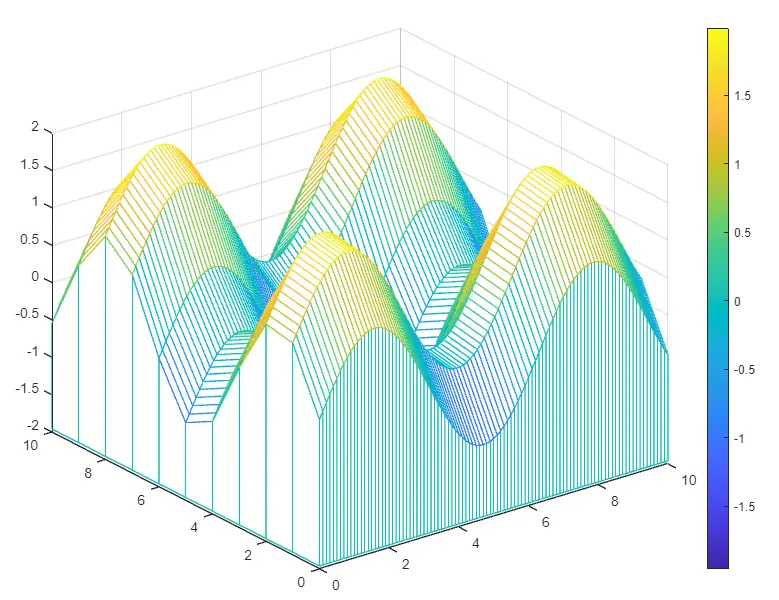
To plot the color map of the given matrix, you can use the meshz() function, which plots the color map of the variable on a given x and y-axis and adds the curtain under the mesh plot. If the coordinates are not given, it will use the indices of the matrix as coordinates. The meshz() function plots a given matrix as heights on the given coordinate. To give the coordinates as input to the meshz() function, you have to use the meshgrid() function to make a mesh of coordinates on which the given matrix will be plotted. For example, let’s plot a matrix. See the code below.
a = 0:0.1:10;
b = 0:10;
[x,y] = meshgrid(a,b);
z = sin(x) + sin(y);
meshz(x,y,z)
colorbar
Output:
You can also change the color map to your desired color range using the colormap function. For example, let’s plot the above sine wave on a summer color map. See the code below.
a = 0:0.1:10;
b = 0:10;
[x,y] = meshgrid(a,b);
z = sin(x) + sin(y);
meshz(x,y,z)
colorbar
colormap winter
Output:
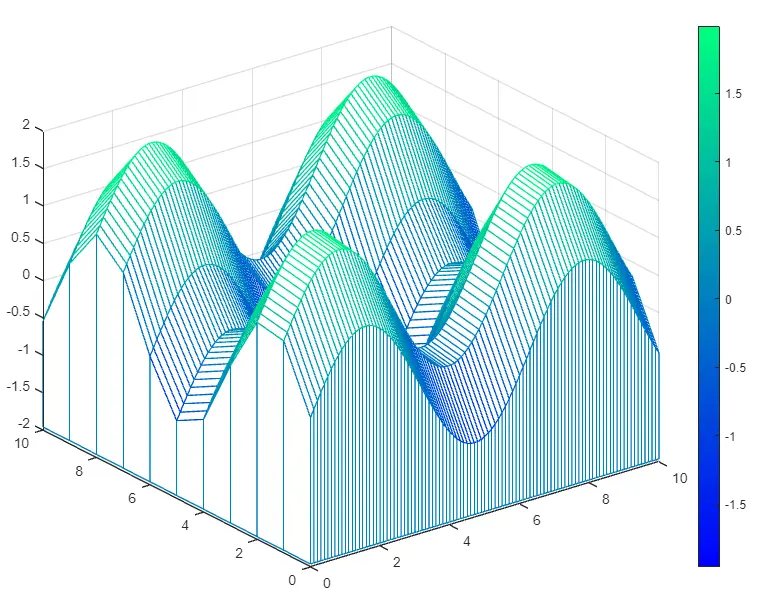
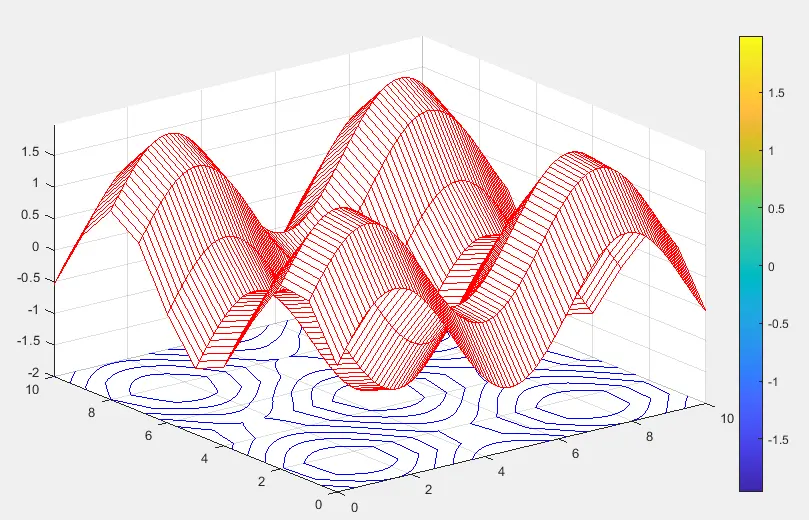
You can also change the edge color of the mesh using the EdgeColor property in meshz() function. See the below code.
a = 0:0.1:10;
b = 0:10;
[x,y] = meshgrid(a,b);
z = sin(x) + sin(y);
sc = meshz(x,y,z)
sc(1).EdgeColor = 'g';
Output:

In the above code, we change the edge color of the mesh plot to blue. You can select any color you want from the available colors. Check this link for more details about the meshz() function.
Plot a Color Map Using the surf() Function in MATLAB
The surf() function performs just like the mesh() function with only one difference that the surf() function plots the matrix with solid face colors while the mesh() function plots the matrix with no face colors. Other than this one difference surf() and mesh() are same functions. Check the mesh() function described above. Check this link for more information about the surf() function.
