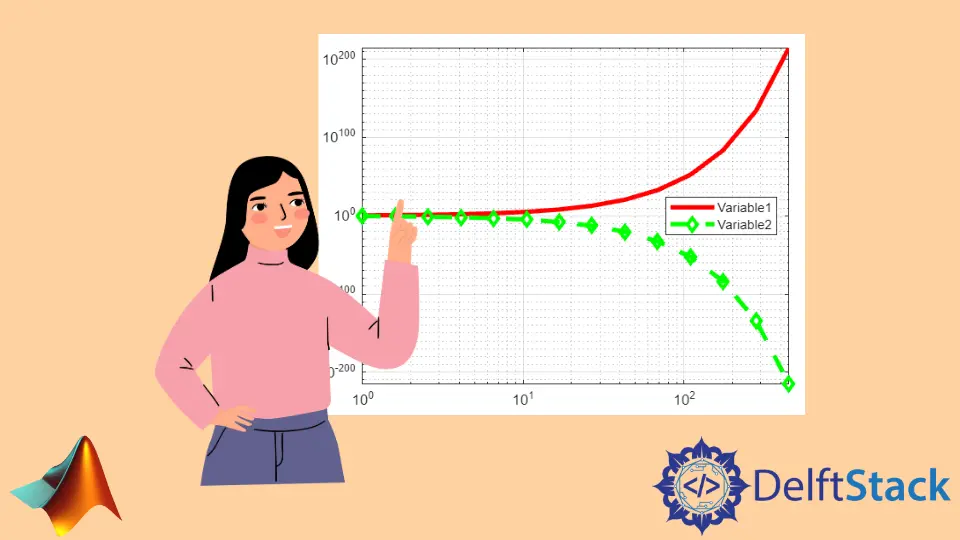
How to Create Log Plot in MATLAB
-
Log Plot Using the
loglog()Function in MATLAB -
Log Plot Using the
semilogx()Function in MATLAB -
Log Plot Using the
semilogy()Function in MATLAB
In this tutorial, we will discuss how we can plot variables on a log scale using the loglog(), semilogx(), and semilogy() functions in MATLAB.
Log Plot Using the loglog() Function in MATLAB
If you want to plot the variables on a base 10 logarithmic scale on the x-axis and y-axis, you can use the loglog() function. See the below code.
a = logspace(0,10);
b = 3.^a;
loglog(a,b)
grid on
Output:
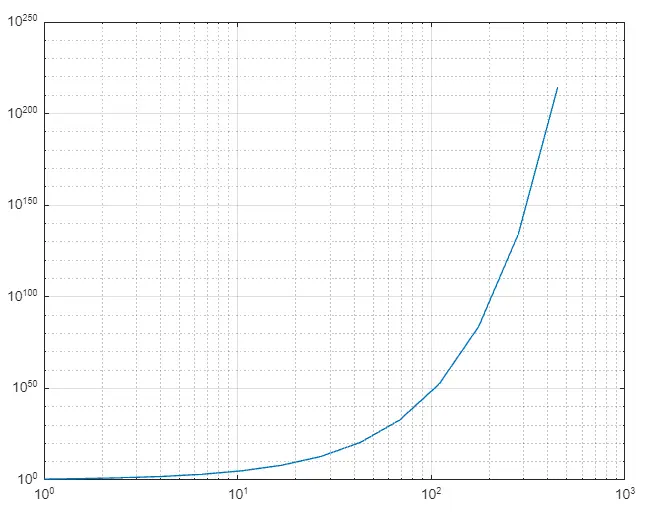
In the above figure, you can see both the axis are in the log scale of base 10. You can also change the plot using different line styles, markers, and colors. For example, let’s plot the above variable again with different properties. See the below code.
a = logspace(0,10);
b = 3.^a;
loglog(a,b,'-ok','LineWidth',3)
grid on
axis tight
Output:
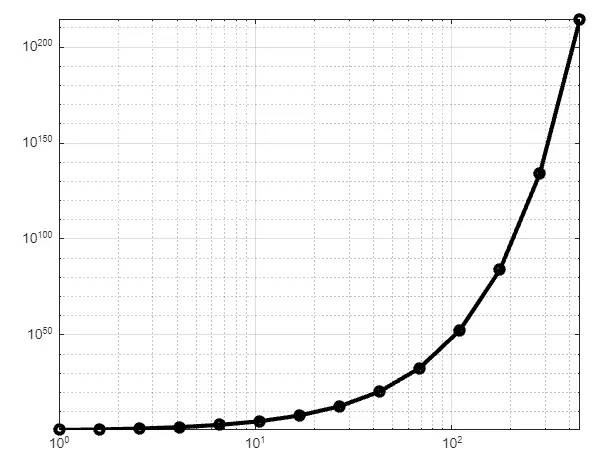
In the above code, we plot a variable on a log scale of base 10 with a line width of 3, a circle marker, and black color. You can also change other properties like marker size, marker edge color, marker face color in the loglog() function. You can also plot multiple variables on the same figure. For example, let’s plot another variable on the above figure with different colors and markers. See the code below.
a = logspace(0,10);
b = 3.^a;
c =1./b;
lg = loglog(a,b,a,c,'--dg','LineWidth',3)
grid on
axis tight
lg(1).Color = 'r';
Output:
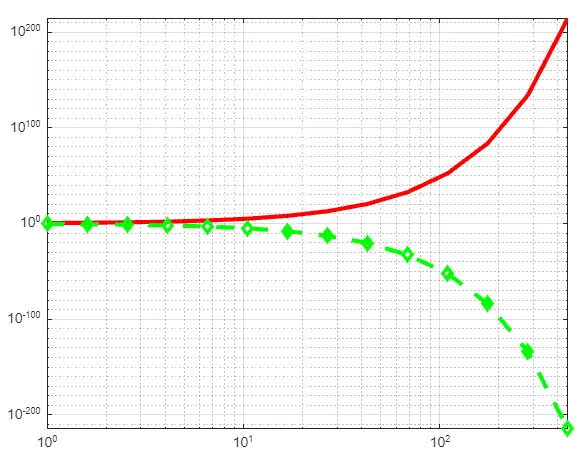
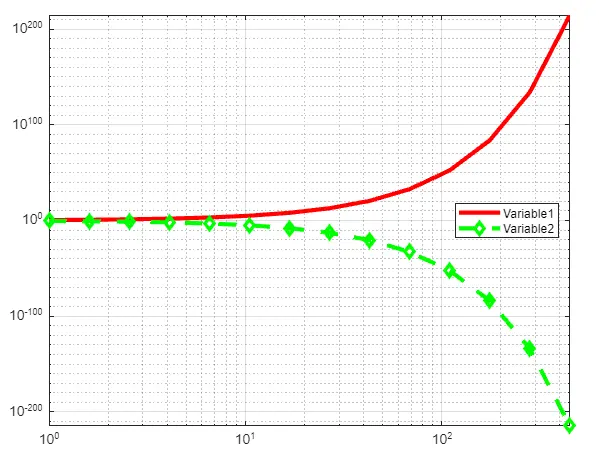
You can also add legends on the plot using the legend() function to mention which plot belongs to which variable. See the below code.
a = logspace(0,10);
b = 3.^a;
c =1./b;
lg = loglog(a,b,a,c,'--dg','LineWidth',3)
grid on
axis tight
lg(1).Color = 'r';
legend('Variable1','Variable2','Location','east')
Output:
You can also plot a matrix using the loglog() function. In the matrix case, each column will be plotted as a different variable with a different color on the same figure. See the code below.
a = 1:10;
b = 2*a;
c = 3*a;
mat = [a;b;c];
lg = loglog(mat)
grid on
axis tight
Output:
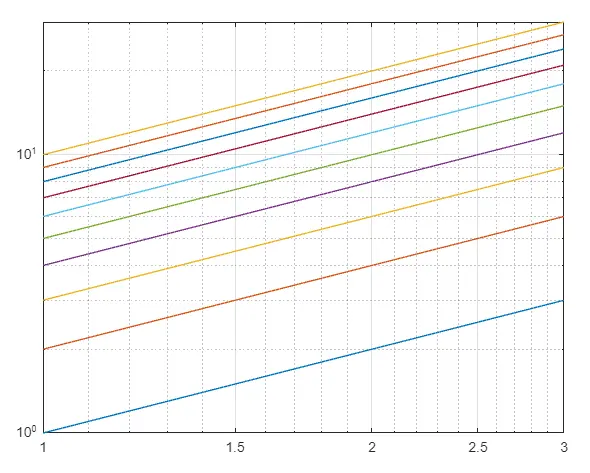
In the above code, we have plotted a matrix containing 10 columns. As you can see in the figure, there are 10 lines, one for each column.
Log Plot Using the semilogx() Function in MATLAB
If you want to plot the variables on the x-axis of base 10 log scale and y-axis of linear scale. You can use the semilogx() function. See the below code.
a = 1:100;
b = 2*a;
lg = semilogx(a,b)
grid on
axis tight
Output:
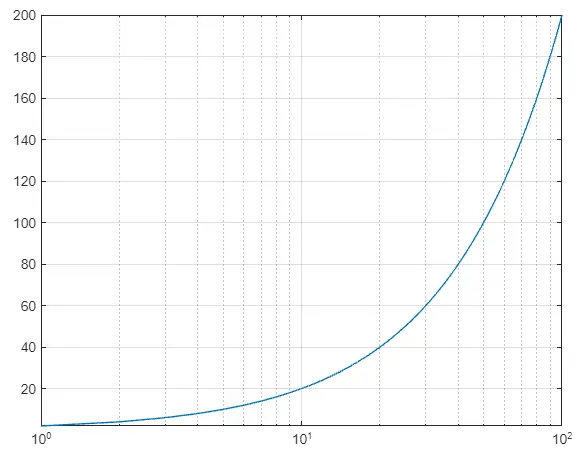
In the above figure, only the x-axis is in the log scale of base 10. You can also plot multiple variables and matrices with different line styles, markers, and colors to make them different from one another using the same method described in the loglog() function. You can also add legends to the plot using the legend() function.
Log Plot Using the semilogy() Function in MATLAB
If you want to plot the variables on the y-axis of base 10 log scale and x-axis of linear scale. You can use the semilogy() function. See the below code.
a = 1:100;
b = 2*a;
lg = semilogy(a,b)
grid on
axis tight
Output:
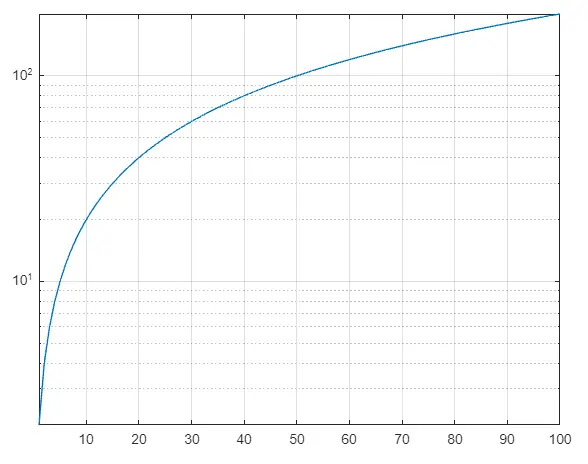
In the above figure, you can see only the y-axis is in the log scale of base 10.
