MATLAB 對數圖
在本教程中,我們將討論如何使用 MATLAB 中的 loglog(),semilogx() 和 semilogy() 函式以對數比例繪製變數。
在 MATLAB 中使用 loglog() 函式進行對數圖
如果要在 x 軸和 y 軸上以 10 為底的對數刻度繪製變數,則可以使用 loglog() 函式。請參見下面的程式碼。
a = logspace(0,10);
b = 3.^a;
loglog(a,b)
grid on
輸出:
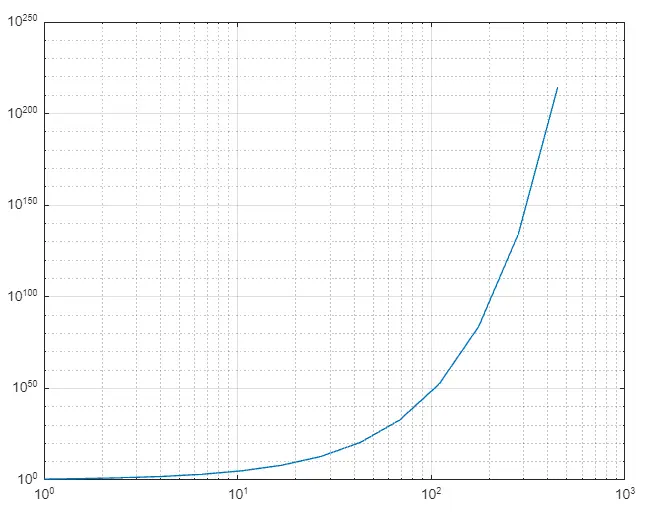
在上圖中,你可以看到兩個軸都以 10 為底的對數刻度。你還可以使用不同的線型、標記和顏色來更改圖形。例如,讓我們用不同的屬性再次繪製上述變數。請參見下面的程式碼。
a = logspace(0,10);
b = 3.^a;
loglog(a,b,'-ok','LineWidth',3)
grid on
axis tight
輸出:
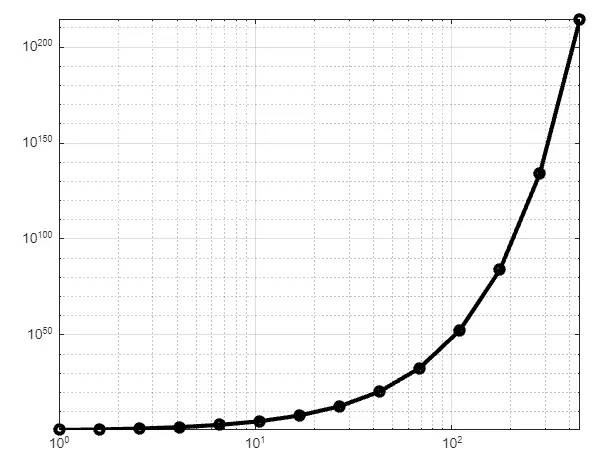
在上面的程式碼中,我們以 10 為底的對數刻度繪製變數,其線寬為 3,帶有圓圈標記和黑色。你還可以在 loglog() 函式中更改其他屬性,例如標記大小,標記邊緣顏色,標記面顏色。你也可以在同一圖形上繪製多個變數。例如,讓我們在上圖中繪製另一個具有不同顏色和標記的變數。請參見下面的程式碼。
a = logspace(0,10);
b = 3.^a;
c =1./b;
lg = loglog(a,b,a,c,'--dg','LineWidth',3)
grid on
axis tight
lg(1).Color = 'r';
輸出:
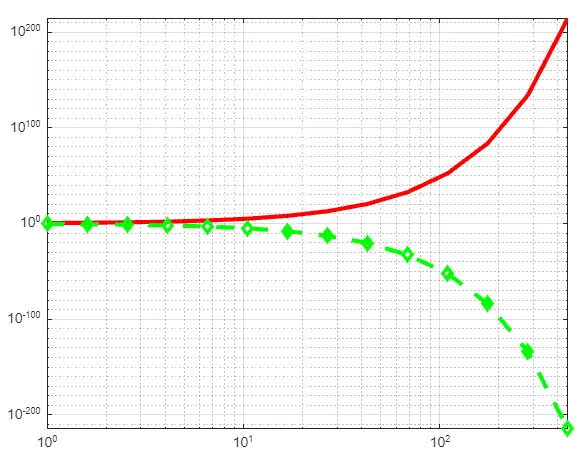
你還可以使用 legend() 函式在圖上新增圖例,以提及哪個圖屬於哪個變數。請參見下面的程式碼。
a = logspace(0,10);
b = 3.^a;
c =1./b;
lg = loglog(a,b,a,c,'--dg','LineWidth',3)
grid on
axis tight
lg(1).Color = 'r';
legend('Variable1','Variable2','Location','east')
輸出:
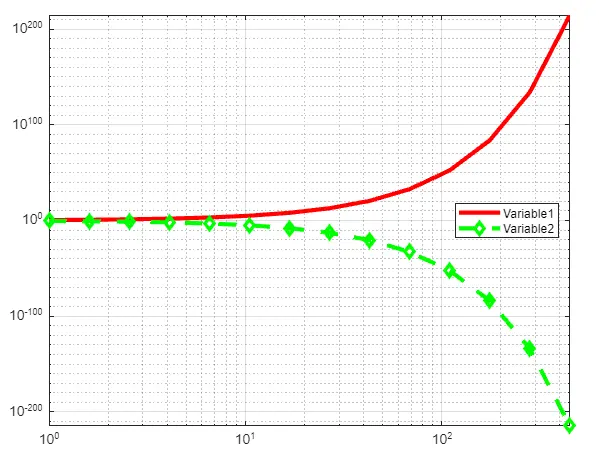
你也可以使用 loglog() 函式繪製矩陣。在矩陣情況下,每列將繪製為同一變數,並在同一圖上顯示為不同的顏色。請參見下面的程式碼。
a = 1:10;
b = 2*a;
c = 3*a;
mat = [a;b;c];
lg = loglog(mat)
grid on
axis tight
輸出:
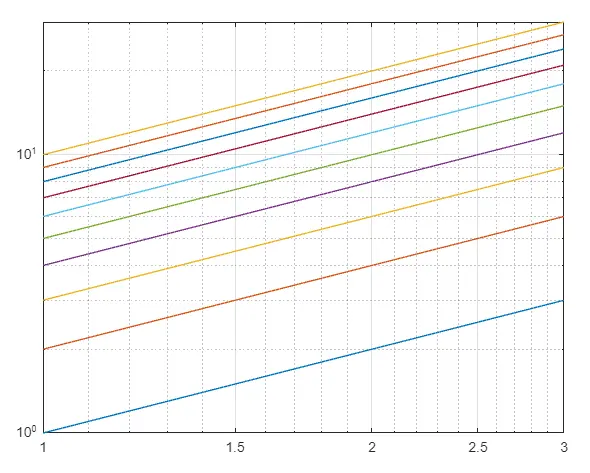
在上面的程式碼中,我們繪製了一個包含 10 列的矩陣。從圖中可以看到,有 10 行,每列一行。
在 MATLAB 中使用 semilogx() 函式進行對數圖
如果要在以 10 為底的對數刻度的 x 軸和線性刻度的 y 軸上繪製變數。你可以使用 semilogx() 函式。請參見下面的程式碼。
a = 1:100;
b = 2*a;
lg = semilogx(a,b)
grid on
axis tight
輸出:
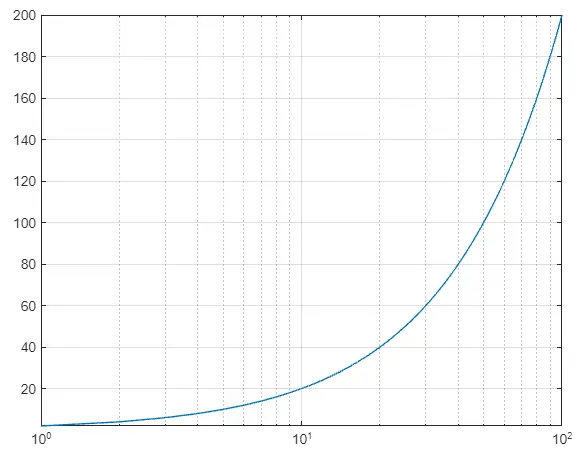
在上圖中,只有 x 軸位於以 10 為底的對數刻度中。你還可以使用與 loglog() 函式。你也可以使用 legend() 函式將圖例新增到繪圖中。
在 MATLAB 中使用 semilogy() 函式進行對數圖
如果要在以 10 為底的對數刻度的 y 軸和線性刻度的 x 軸上繪製變數。你可以使用 semilogy() 函式。請參見下面的程式碼。
a = 1:100;
b = 2*a;
lg = semilogy(a,b)
grid on
axis tight
輸出:
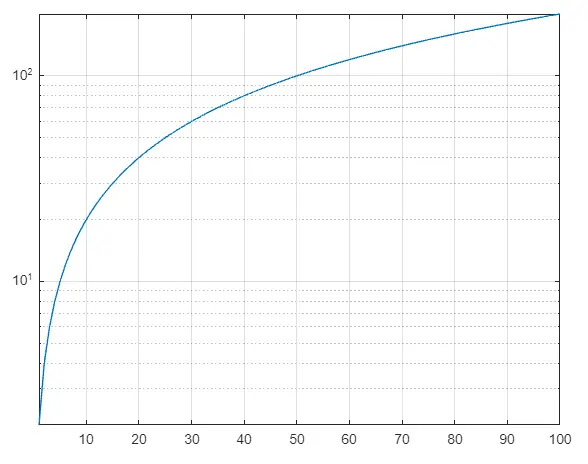
在上圖中,你只能看到 y 軸位於以 10 為底的對數刻度中。
