How to Create Multiple Line Plot Seaborn

This tutorial will discuss creating a multiple-line plot using Seaborn’s lineplot() function.
Multiple Line Plot in Seaborn
Seaborn’s lineplot() function plots data as a line. We must pass the x and y-axis values to the function to plot a line. If we want to plot multiple lines, we must make a data frame of the given data where each column corresponds to each line.
To plot five lines at the same plot, we must save data of each line inside a data frame as a column and then pass the data frame inside the lineplot() to plot multiple lines. The lineplot() function will use the column values of the data frame as the y-axis values and the index of the values as the x-axis values to plot the lines.
Let’s create an array containing five columns and six rows. We will use the DataFrame() function of the pandas library to create the data frame. We must pass the array and the number of rows and columns inside the DataFrame() function.
We will use the data argument of the lineplot() function to pass the data frame inside the function. See the code below.
import seaborn as snNew
import pandas as pdNew
import matplotlib.pyplot as pltNew

array = [
    [11, 1, 0, 2, 0],
    [3, 8, 0, 1, 0],
    [0, 16, 3, 0, 0],
    [0, 0, 12, 0, 0],
    [0, 0, 0, 13, 0],
    [0, 1, 0, 0, 16],
]

DetaFrame_cm = pdNew.DataFrame(array, range(6), range(5))
snNew.lineplot(data=DetaFrame_cm)
pltNew.show()
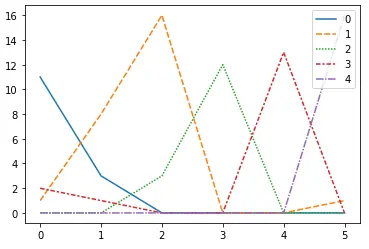
The function has plotted five lines with different colors and line styles. We can create a NumPy array of the given data to plot the five lines using the ndarray() function of the NumPy library and can use it to plot the five lines.
Use the markers argument of the lineplot() function to plot markers inside the lines. By default, this argument is false, but we can set it to true or a list containing marker symbols. If the argument is set to true, the function will handle the markers.
We can change the color palette to give colors to the lines using the palette argument and set its value to a palette name like dark for dark colors. By default, the legends are set to true, but we can hide the legends by setting the legend argument to false.
Using the linewidth argument, we can change the line width and set its value to a floating-point number. We can set the marker size to any floating-point value using the ms or markersize argument.
Set the marker face color to any color using the mfc or markerfacecolor argument and the color or the first letter like r for red. We can set the marker edge color to any color using the mec or markeredgecolor argument.
Set the marker edge width to any floating-point value using the mew or markeredgewidth argument. Let’s change the properties mentioned above.
See the code below.
import seaborn as snNew
import pandas as pdNew
import matplotlib.pyplot as pltNew
array = [
[11, 1, 0, 2, 0],
[3, 8, 0, 1, 0],
[0, 16, 3, 0, 0],
[0, 0, 12, 0, 0],
[0, 0, 0, 13, 0],
[0, 1, 0, 0, 16],
]
DetaFrame_cm = pdNew.DataFrame(array, range(6), range(5))
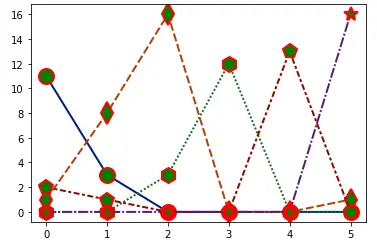
snNew.lineplot(
data=DetaFrame_cm,
markers=["o", "d", "h", "p", "*"],
palette="dark",
legend=False,
linewidth=2,
ms=15,
mec="r",
mew=2,
mfc="g",
)
pltNew.show()
Output:
Set the text’s font size in the plot using the set() function and font_scale argument. To increase the font size, we must set the font_scale value higher than one, decrease its value, and set it to less than 1.
To increase the text’s font size in the plot, we must use the code below.
snNew.set(font_scale=1.5)
