Seaborn 多线图

本教程将讨论使用 Seaborn 的 lineplot() 函数创建多线图。
Seaborn 中的多线图
Seaborn 的 lineplot() 函数将数据绘制为一条线。我们必须将 x 和 y 轴值传递给函数来绘制一条线。如果我们想绘制多条线,我们必须为给定数据制作一个数据框,其中每列对应于每条线。
要在同一个图上绘制五条线,我们必须将数据框中每条线的数据保存为一列,然后将数据框传递给 lineplot() 以绘制多条线。lineplot() 函数将使用数据框的列值作为 y 轴值,并将值的索引作为 x 轴值来绘制线条。
让我们创建一个包含五列六行的数组。我们将使用 pandas 库的 DataFrame() 函数来创建数据框。我们必须在 DataFrame() 函数中传递数组以及行数和列数。
我们将使用 lineplot() 函数的数据参数在函数内部传递数据框。请参阅下面的代码。
import seaborn as snNew
import pandas as pdNew
import matplotlib.pyplot as pltNew

array = [
    [11, 1, 0, 2, 0],
    [3, 8, 0, 1, 0],
    [0, 16, 3, 0, 0],
    [0, 0, 12, 0, 0],
    [0, 0, 0, 13, 0],
    [0, 1, 0, 0, 16],
]

DetaFrame_cm = pdNew.DataFrame(array, range(6), range(5))
snNew.lineplot(data=DetaFrame_cm)
pltNew.show()
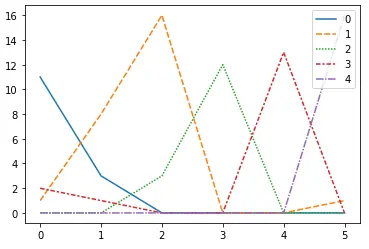
该函数绘制了五条具有不同颜色和线型的线。我们可以使用 NumPy 库的 ndarray() 函数创建给定数据的 NumPy 数组来绘制五条线,并可以使用它来绘制五条线。
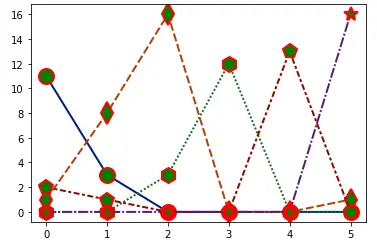
使用 lineplot() 函数的标记参数在线条内绘制标记。默认情况下,此参数为 false,但我们可以将其设置为 true 或包含标记符号的列表。如果参数设置为 true,该函数将处理标记。
我们可以使用 palette 参数更改调色板以赋予线条颜色,并将其值设置为调色板名称,例如深色用于深色。默认情况下,图例设置为 true,但我们可以通过将 legend 参数设置为 false 来隐藏图例。
使用 linewidth 参数,我们可以更改线宽并将其值设置为浮点数。我们可以使用 ms 或 markersize 参数将标记大小设置为任何浮点值。
使用 mfc 或 markerfacecolor 参数和颜色或第一个字母(如 r 表示红色)将标记面颜色设置为任何颜色。我们可以使用 mec 或 markeredgecolor 参数将标记边缘颜色设置为任何颜色。
使用 mew 或 markeredgewidth 参数将标记边缘宽度设置为任何浮点值。让我们更改上面提到的属性。
请参阅下面的代码。
import seaborn as snNew
import pandas as pdNew
import matplotlib.pyplot as pltNew

array = [
    [11, 1, 0, 2, 0],
    [3, 8, 0, 1, 0],
    [0, 16, 3, 0, 0],
    [0, 0, 12, 0, 0],
    [0, 0, 0, 13, 0],
    [0, 1, 0, 0, 16],
]

DetaFrame_cm = pdNew.DataFrame(array, range(6), range(5))
snNew.lineplot(
    data=DetaFrame_cm,
    markers=["o", "d", "h", "p", "*"],
    palette="dark",
    legend=False,
    linewidth=2,
    ms=15,
    mec="r",
    mew=2,
    mfc="g",
)
pltNew.show()
输出:
使用 set() 函数和 font_scale 参数在绘图中设置文本的字体大小。要增加字体大小,我们必须将 font_scale 值设置为大于 1,减小其值,然后将其设置为小于 1。
为了增加图中文本的字体大小,我们必须使用下面的代码。
snNew.set(font_scale=1.5)
