Seaborn 联合图
Ammar Ali
2024年2月15日
Seaborn
Seaborn Plot

本教程将讨论使用 Seaborn 的 jointplot() 函数创建两个变量的联合图。
Seaborn 联合图
我们可以使用 jointplot() 函数在 Seaborn 中绘制两个变量。要创建联合图,我们必须使用 pandas 库或 numpy 创建给定数据的数据框,并使用 data 参数将其传递给 jointplot() 函数。
让我们使用 pandas 库的 DataFrame() 函数创建一个数据框,并使用该数据框绘制一个联合图。请参阅下面的代码。
import seaborn as snNew
import pandas as pdNew
import matplotlib.pyplot as pltNew
array = [
[11, 1, 0, 2, 0],
[3, 8, 0, 1, 0],
[0, 16, 3, 0, 0],
[0, 0, 12, 0, 0],
[0, 0, 0, 13, 0],
[0, 1, 0, 0, 16],
]
DetaFrame_cm = pdNew.DataFrame(array, range(6), range(5))
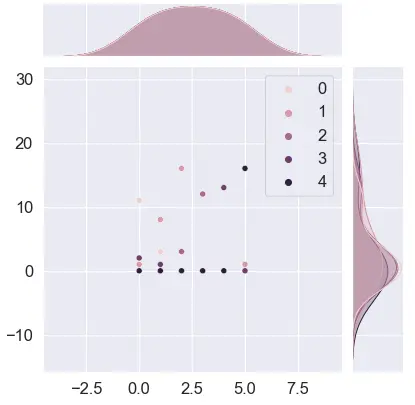
snNew.jointplot(data=DetaFrame_cm)
pltNew.show()
输出:
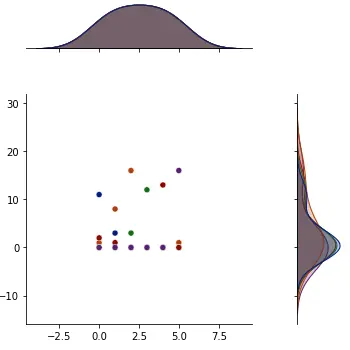
我们可以使用 numpy 库的 ndarray() 函数创建一个给定数据的 numpy 数组来绘制五条线,并使用它来绘制五条线。我们可以使用 palette 参数更改调色板以为数据点提供颜色,并将其值设置为调色板名称,例如深色用于深色。
默认情况下,图例设置为 true,但我们可以通过将 legend 参数设置为 false 来隐藏图例。图表的高度默认为六,但我们可以使用 height 参数将其设置为任何数值。
默认情况下,边缘轴和关节轴高度的比率设置为 5,但我们可以将其更改为任何数值。这个比率决定了每个图的大小。默认情况下,边缘轴和关节轴之间的间距为 0.2,但我们可以将其更改为任何数值。
让我们更改上面提到的属性。请参阅下面的代码。
import seaborn as snNew
import pandas as pdNew
import matplotlib.pyplot as pltNew

array = [
    [11, 1, 0, 2, 0],
    [3, 8, 0, 1, 0],
    [0, 16, 3, 0, 0],
    [0, 0, 12, 0, 0],
    [0, 0, 0, 13, 0],
    [0, 1, 0, 0, 16],
]

DetaFrame_cm = pdNew.DataFrame(array, range(6), range(5))
snNew.jointplot(
    data=DetaFrame_cm, palette="dark", legend=False, height=5, ratio=3, space=1
)
pltNew.show()
输出:
Enjoying our tutorials? Subscribe to DelftStack on YouTube to support us in creating more high-quality video guides. Subscribe
作者: Ammar Ali
