Seaborn 聯合圖
Ammar Ali
2024年2月15日
Seaborn
Seaborn Plot

本教程將討論使用 Seaborn 的 jointplot() 函式建立兩個變數的聯合圖。
Seaborn 聯合圖
我們可以使用 jointplot() 函式在 Seaborn 中繪製兩個變數。要建立聯合圖,我們必須使用 pandas 庫或 numpy 建立給定資料的資料框,並使用 data 引數將其傳遞給 jointplot() 函式。
讓我們使用 pandas 庫的 DataFrame() 函式建立一個資料框,並使用該資料框繪製一個聯合圖。請參閱下面的程式碼。
import seaborn as snNew
import pandas as pdNew
import matplotlib.pyplot as pltNew
array = [
[11, 1, 0, 2, 0],
[3, 8, 0, 1, 0],
[0, 16, 3, 0, 0],
[0, 0, 12, 0, 0],
[0, 0, 0, 13, 0],
[0, 1, 0, 0, 16],
]
DetaFrame_cm = pdNew.DataFrame(array, range(6), range(5))
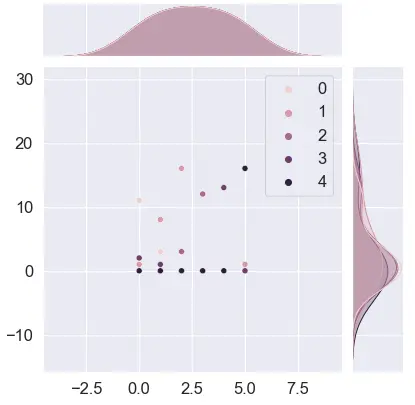
snNew.jointplot(data=DetaFrame_cm)
pltNew.show()
輸出:
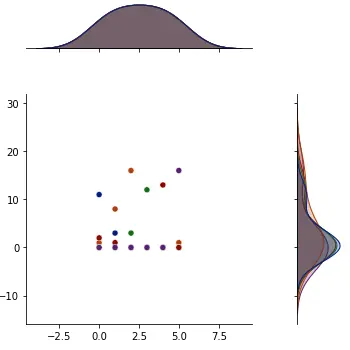
我們可以使用 numpy 庫的 ndarray() 函式建立一個給定資料的 numpy 陣列來繪製五條線,並使用它來繪製五條線。我們可以使用 palette 引數更改調色盤以為資料點提供顏色,並將其值設定為調色盤名稱,例如深色用於深色。
預設情況下,圖例設定為 true,但我們可以通過將 legend 引數設定為 false 來隱藏圖例。圖表的高度預設為六,但我們可以使用 height 引數將其設定為任何數值。
預設情況下,邊緣軸和關節軸高度的比率設定為 5,但我們可以將其更改為任何數值。這個比率決定了每個圖的大小。預設情況下,邊緣軸和關節軸之間的間距為 0.2,但我們可以將其更改為任何數值。
讓我們更改上面提到的屬性。請參閱下面的程式碼。
import seaborn as snNew
import pandas as pdNew
import matplotlib.pyplot as pltNew

array = [
    [11, 1, 0, 2, 0],
    [3, 8, 0, 1, 0],
    [0, 16, 3, 0, 0],
    [0, 0, 12, 0, 0],
    [0, 0, 0, 13, 0],
    [0, 1, 0, 0, 16],
]

DetaFrame_cm = pdNew.DataFrame(array, range(6), range(5))
snNew.jointplot(
    data=DetaFrame_cm, palette="dark", legend=False, height=5, ratio=3, space=1
)
pltNew.show()
輸出:
Enjoying our tutorials? Subscribe to DelftStack on YouTube to support us in creating more high-quality video guides. Subscribe
作者: Ammar Ali
