How to Draw Legend Items With Different Colors in R
-
Use the
legendFunction to Add Legend to Plots in R -
Use Double
legendCall to Draw Legend Items With Different Colors

This article will demonstrate how to draw legend items with different colors in R.
Use the legend Function to Add Legend to Plots in R
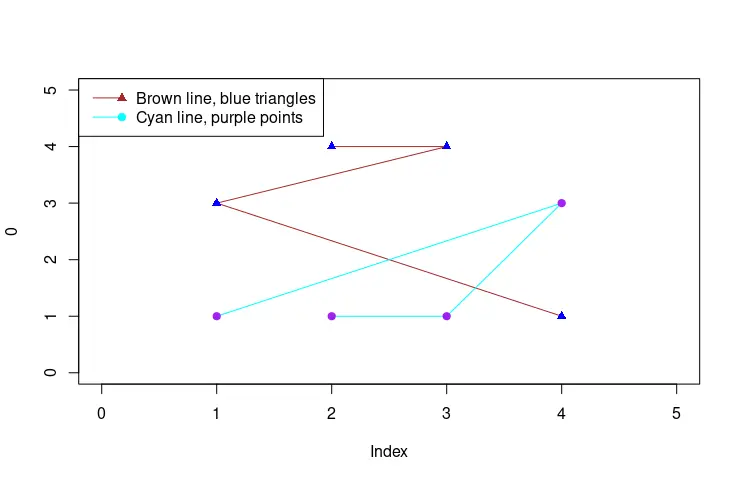
The legend function is used to draw legend objects on the plots. It takes x and y coordinates as the first two arguments to specify the legend’s position. Although, it can be specified using keywords like: "left", "bottomright", etc. The next parameter is called legend, and it is represented as a vector of characters that need to be displayed in the legend. In this case, we draw lines and points denoted by a triangle or circle shape. Lines and points have different colors, and they need to be displayed in the legend accordingly. The following code snippet draws only shapes and text in the legend.
library(ggplot2)

plot( 0, type = "n", xlim = c(0,5), ylim = c(0,5) )
A <- matrix( c( c(4,1,3,2), c(1,3,4,4)), ncol = 2 )
B <- matrix( c( c(1,4,3,2), c(1,3,1,1)), ncol = 2 )

lines( A, col = "brown" )
points( A, col = "blue", pch = 17 )
lines( B, col = "cyan" )
points( B, col = "purple", pch = 19 )


legend( x = "topleft",
        legend = c("Brown line, blue triangles","Cyan line, purple points"),
        col = c("blue","purple"), lwd = 2, lty = c(0,0),
        pch = c(17,19) )

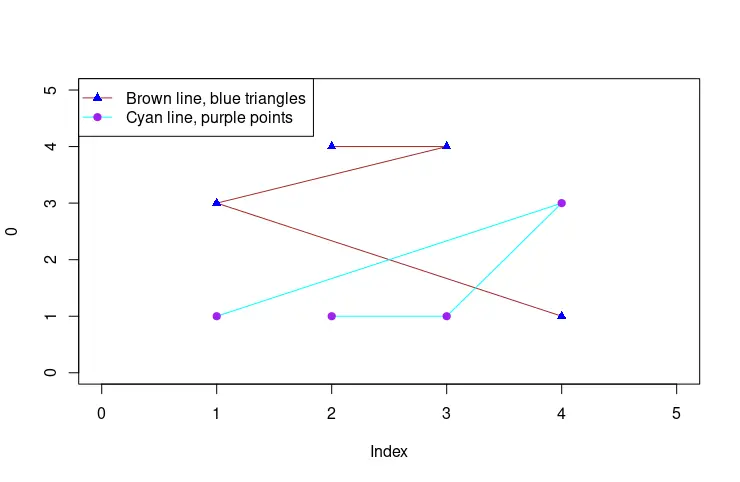
We can also add lines by increasing the values of the lty argument vector. Notice that ones correspond to the straight and uninterrupted line. On the other hand, pch arguments represent the plotting symbols that map to 0:25 integer values and are described in points function documentation.
library(ggplot2)

plot( 0, type = "n", xlim = c(0,5), ylim = c(0,5) )
A <- matrix( c( c(4,1,3,2), c(1,3,4,4)), ncol = 2 )
B <- matrix( c( c(1,4,3,2), c(1,3,1,1)), ncol = 2 )

lines( A, col = "brown" )
points( A, col = "blue", pch = 17 )
lines( B, col = "cyan" )
points( B, col = "purple", pch = 19 )

legend( x = "topleft",
        legend = c("Brown line, blue triangles","Cyan line, purple points"),
        col = c("brown","cyan"), lwd = 1, lty = c(1,1),
        pch = c(17,19), merge = FALSE)
Use Double legend Call to Draw Legend Items With Different Colors
The previous example displays the lines and shapes of a single item with the same color. This can be solved by the two invocations of the legend function, each of which displays lines and shapes separately with different colors. Mind though, one of the calls should have empty vector values for the legend parameter.
library(ggplot2)

plot( 0, type = "n", xlim = c(0,5), ylim = c(0,5) )
A <- matrix( c( c(4,1,3,2), c(1,3,4,4)), ncol = 2 )
B <- matrix( c( c(1,4,3,2), c(1,3,1,1)), ncol = 2 )

lines( A, col = "brown" )
points( A, col = "blue", pch = 17 )
lines( B, col = "cyan" )
points( B, col = "purple", pch = 19 )


legend( x = "topleft",
        legend = c("Brown line, blue triangles","Cyan line, purple points"),
        col = c("brown","cyan"), lwd = 1, lty = c(1,1),
       pch = c(NA,NA) )

legend( x = "topleft",
        legend = c("",""),
        col = c("blue","purple"), lwd = 1, lty = c(0,0),
        pch = c(17,19), bty= 'n')

Founder of DelftStack.com. Jinku has worked in the robotics and automotive industries for over 8 years. He sharpened his coding skills when he needed to do the automatic testing, data collection from remote servers and report creation from the endurance test. He is from an electrical/electronics engineering background but has expanded his interest to embedded electronics, embedded programming and front-/back-end programming.
LinkedIn Facebook