R에서 다른 색으로 범례 항목 그리기

이 기사는 R에서 다른 색상으로 범례 항목을 그리는 방법을 보여줍니다.
legend함수를 사용하여 R의 플롯에 범례 추가
legend함수는 플롯에 범례 개체를 그리는 데 사용됩니다. 범례의 위치를 지정하기 위해x및y좌표를 처음 두 인수로 사용합니다. 그러나"left","bottomright"등과 같은 키워드를 사용하여 지정할 수 있습니다. 다음 매개 변수는legend라고하며 범례에 표시해야하는 문자의 벡터로 표시됩니다. 이 경우 삼각형 또는 원 모양으로 표시된 선과 점을 그립니다. 선과 점은 색상이 다르므로 그에 따라 범례에 표시해야합니다. 다음 코드 조각은 범례에 모양과 텍스트 만 그립니다.
library(ggplot2)

plot( 0, type = "n", xlim = c(0,5), ylim = c(0,5) )
A <- matrix( c( c(4,1,3,2), c(1,3,4,4)), ncol = 2 )
B <- matrix( c( c(1,4,3,2), c(1,3,1,1)), ncol = 2 )

lines( A, col = "brown" )
points( A, col = "blue", pch = 17 )
lines( B, col = "cyan" )
points( B, col = "purple", pch = 19 )


legend( x = "topleft",
        legend = c("Brown line, blue triangles","Cyan line, purple points"),
        col = c("blue","purple"), lwd = 2, lty = c(0,0),
        pch = c(17,19) )

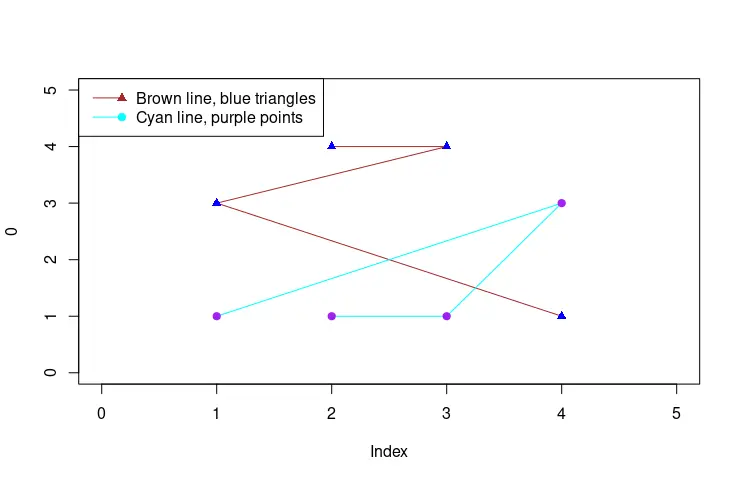
lty인수 벡터의 값을 늘려 줄을 추가 할 수도 있습니다. 하나는 직선과 연속 선에 해당합니다. 반면,pch인수는0:25정수 값에 매핑되는 플로팅 기호를 나타내며points함수 문서에 설명되어 있습니다.
library(ggplot2)

plot( 0, type = "n", xlim = c(0,5), ylim = c(0,5) )
A <- matrix( c( c(4,1,3,2), c(1,3,4,4)), ncol = 2 )
B <- matrix( c( c(1,4,3,2), c(1,3,1,1)), ncol = 2 )

lines( A, col = "brown" )
points( A, col = "blue", pch = 17 )
lines( B, col = "cyan" )
points( B, col = "purple", pch = 19 )

legend( x = "topleft",
        legend = c("Brown line, blue triangles","Cyan line, purple points"),
        col = c("brown","cyan"), lwd = 1, lty = c(1,1),
        pch = c(17,19), merge = FALSE)
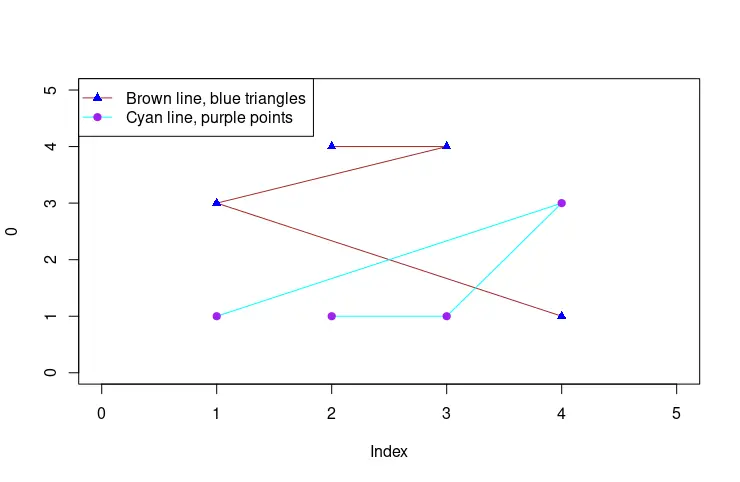
Double legend Call을 사용하여 다른 색상으로 범례 항목 그리기
이전 예제는 동일한 색상으로 단일 항목의 선과 모양을 표시합니다. 이 문제는legend함수를 두 번 호출하여 해결할 수 있습니다. 각 함수는 선과 모양을 서로 다른 색상으로 개별적으로 표시합니다. 그러나 호출 중 하나는legend매개 변수에 대해 빈 벡터 값을 가져야합니다.
library(ggplot2)

plot( 0, type = "n", xlim = c(0,5), ylim = c(0,5) )
A <- matrix( c( c(4,1,3,2), c(1,3,4,4)), ncol = 2 )
B <- matrix( c( c(1,4,3,2), c(1,3,1,1)), ncol = 2 )

lines( A, col = "brown" )
points( A, col = "blue", pch = 17 )
lines( B, col = "cyan" )
points( B, col = "purple", pch = 19 )


legend( x = "topleft",
        legend = c("Brown line, blue triangles","Cyan line, purple points"),
        col = c("brown","cyan"), lwd = 1, lty = c(1,1),
       pch = c(NA,NA) )

legend( x = "topleft",
        legend = c("",""),
        col = c("blue","purple"), lwd = 1, lty = c(0,0),
        pch = c(17,19), bty= 'n')

Founder of DelftStack.com. Jinku has worked in the robotics and automotive industries for over 8 years. He sharpened his coding skills when he needed to do the automatic testing, data collection from remote servers and report creation from the endurance test. He is from an electrical/electronics engineering background but has expanded his interest to embedded electronics, embedded programming and front-/back-end programming.
LinkedIn Facebook