How to Plot Histogram for List of Data in Matplotlib
We can use the plt.hist() method to plot histograms from a list of data.
Syntax of the Maplotlib hist() method
matplotlib.pyplot.hist(x,
                       bins=None,
                       range=None,
                       density=False,
                       weights=None,
                       cumulative=False,
                       bottom=None,
                       histtype='bar',
                       align='mid',
                       orientation='vertical',
                       rwidth=None,
                       log=False,
                       color=None,
                       label=None,
                       stacked=False, *,
                       data=None,
                       **kwargs)
log is False by default. If log is set to be True, the axis of the histogram will be in a log scale.
Examples: Plot Histogram Using Matplotlib From the List of Data
import matplotlib.pyplot as plt

data = [3, 4, 2, 3, 4, 5, 4, 7, 8, 5, 4, 6, 2, 1, 0, 9, 7, 6, 6, 5, 4]

n, bins, patches = plt.hist(data)
plt.xlabel("Values")
plt.ylabel("Frequency")
plt.title("Histogram")
plt.show()
Output:

Here, we have values in a list - data. We pass this list into the plt.hist() command to generate a histogram from the list of values. The plt.hist() method returns the frequency of bins, endpoints of bins, and a list of patches used to create the histogram.
In the example, we haven’t set the value of the bins parameter. By default, the number of bins is 10, so the script creates the histogram from the list of data with 10 bins.
Additionally, we can control the number of bins using the bins command while making the histogram.
import matplotlib.pyplot as plt

data = [3, 4, 2, 3, 4, 5, 4, 7, 8, 5, 4, 6, 2, 1, 0, 9, 7, 6, 6, 5, 4]
n, bins, patches = plt.hist(data, bins=20)
plt.xlabel("Values")
plt.ylabel("Frequency")
plt.title("Histogram with 20 bins")
plt.show()
Output:

This process displays the histogram made from 20 bins, as a result of equally dividing the entire range of the list values.
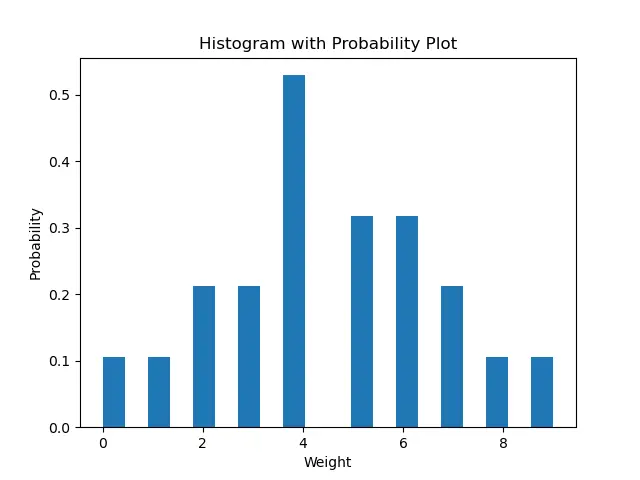
By default, the value of the density parameter is set to False; this means that we get the plot of each bin’s exact count in the histogram. If we want to make the plot of probability densities of each bin in the list, we need to set the density to True. If density is True, the area under the histogram integrates to 1.
import matplotlib.pyplot as plt

data = [3, 4, 2, 3, 4, 5, 4, 7, 8, 5, 4, 6, 2, 1, 0, 9, 7, 6, 6, 5, 4]
n, bins, patches = plt.hist(data, bins=20, density=True)
plt.xlabel("Weight")
plt.ylabel("Probability")
plt.title("Histogram with Probability Plot")
plt.show()
Output:
We can now set the color of the histogram using the color parameter.
import matplotlib.pyplot as plt

data = [3, 4, 2, 3, 4, 5, 4, 7, 8, 5, 4, 6, 2, 1, 0, 9, 7, 6, 6, 5, 4]
n, bins, patches = plt.hist(data, bins=20, density=True, color="red")
plt.xlabel("Weight")
plt.ylabel("Probability")
plt.title("Red Histogram Plot")
plt.show()
Output:
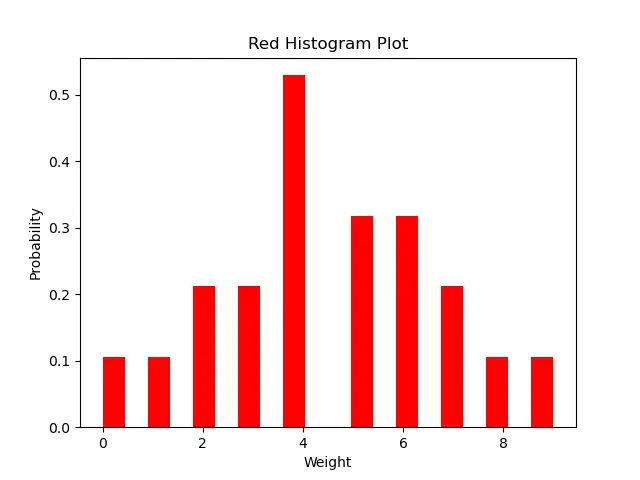
This method generates the histogram with red color.

Suraj Joshi is a backend software engineer at Matrice.ai.
LinkedIn