Text Box in MATLAB
-
Add a Text Box on a Plot Using the
annotation()Function in MATLAB -
Add a Text Box on a Plot Using the
text()Function in MATLAB
This tutorial will discuss how to add a text box on a plot using the annotation() and text() function in MATLAB.
Add a Text Box on a Plot Using the annotation() Function in MATLAB
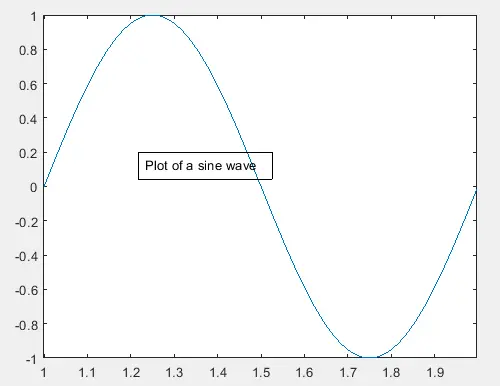
To add a text box with some text on a plot in MATLAB, you can use the annotation() function. The annotation() function creates a text box with given dimensions on the plot and adds given text to the text box. To add the given text to the text box, we have to use the String property inside the annotation() function. We can also use the FitBoxToText to add fit the box to the given text. For example, let’s plot a sine wave and add a text box with some text in it. See the code below.
t = 1:0.01:2;
x = sin(2*pi*t);
figure
plot(t,x)
dimen = [.3 .1 .5 .5];
text = 'Plot of a sine wave';
a = annotation('textbox',dimen,'String',text,'FitBoxToText','on')
Output:
In the above code, you can change the text and dimensions of the text box according to your requirements. You can also change the name of the font using the FontName property, the size of the font using the FontSize property, the color of the text using the Color property, the background color of the text box using the BackgroundColor property, and the color of the box using the EdgeColor property. For example, let’s change all these properties of the text box using a function handle. See the code below.
t = 1:0.01:2;
x = sin(2*pi*t);
figure
plot(t,x)
dimen = [.3 .1 .5 .5];
text = 'Plot of a sine wave';
a = annotation('textbox',dimen,'String',text,'FitBoxToText','on')
a.FontName = 'Arial';
a.FontSize = 18;
a.Color = [1 0 0];
a.BackgroundColor = 'y';
a.EdgeColor = [0 1 0];
Output:
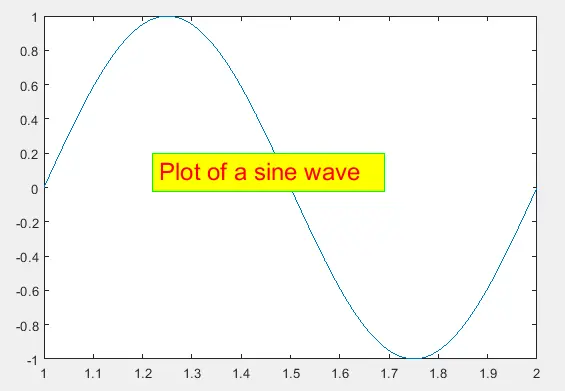
In the above code, the function handle a will display all the properties of the text box on the command window, which we can change using the function handle a. Check this link for more details about the annotation() function.
Add a Text Box on a Plot Using the text() Function in MATLAB
You can also use the text() function to add text with a box to the plot. You need to pass the x and y coordinate on which you want to place the text. Simply plot the variable and then select the coordinates from the plot and then use the text() function to place the text on the selected coordinates. If you give the coordinates which don’t lie on the plot, you can’t see the text. You can also change the properties of the text like the font size using the FontSize property and the color using the Color property etc. For example, let’s plot a cosine wave and put some text on it with font size 18 and red color and a black box around the text. See the code below.
t = 1:0.01:2;
plot(cos(2*pi*t))
tex = text(20,0.8,'Plot of Cosine wave','FontSize',18,'Color','r','EdgeColor','k')
Output:
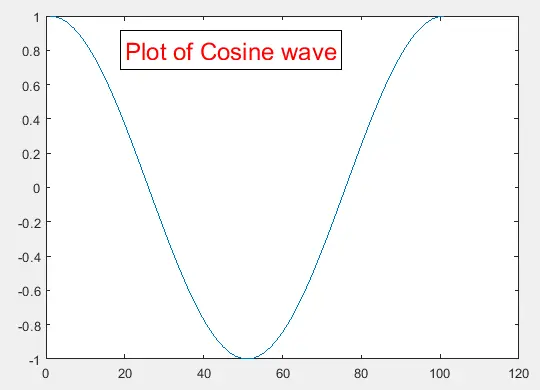
You can give your desired color to the text using the Color property and the box using the EdgeColor property. You can also add multiple texts at multiple positions on the plot with different text, line styles, color, size, and box. Check this link for more details about the annotation() function.
