How to Plot Circle in MATLAB
-
Plotting a Circle Using the
rectangle()Function in MATLAB -
Plotting a Circle Using the
plot()Function in MATLAB -
Plotting a Circle Using the
viscircles()Function in MATLAB - Conclusion
Plotting geometric shapes like circles is a fundamental aspect of data visualization in MATLAB. Circles can represent various data points, regions of interest, or simply add aesthetic elements to your plots. MATLAB provides several methods to plot circles, and
In this article, we will explore three commonly used functions for this purpose: rectangle(), plot(), and viscircles().
Plotting a Circle Using the rectangle() Function in MATLAB
We can use the rectangle() function to plot a circle in Matlab. We have to pass the position using the Position property and set the curvature to 1 using the Curvature property inside the rectangle() function. For example, let’s plot a circle using the rectangle() function. See the code below.
position = [2 4 2 2];
rectangle('Position',position,'Curvature',[1 1])
axis equal
Output:

The position vector contains four values.
The first value is the x coordinate.
Meanwhile, the second value is the y coordinate.
The third value is the width of the circle, and the fourth value is the height of the circle.
The width and height values should be equal to plot the circle.
We can also change other properties of the circle like the width of the line using the LineWidth property, the line style using the LineStyle property, the face color or the fill color using the FaceColor property, and the edge color or the color of the line using the EdgeColor property.
The line width should be a positive numeric value.
We can add any color as face and edge color. The supported line styles are dashed, dash-dotted, dotted, and none.
For example, let’s change the line width of the above circle to 5, the face color to yellow, the edge color to red, and the line style to dash-dotted. See the code below.
position = [2 4 2 2];
rectangle('Position',position,'Curvature',[1 1],'FaceColor','yellow','EdgeColor','red','LineWidth',5,'LineStyle','-.')
axis equal
Output:
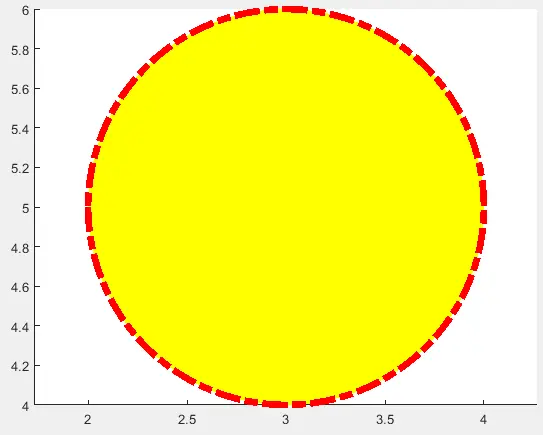
In the output, the properties of the circle have been changed.
Plotting a Circle Using the plot() Function in MATLAB
Plotting a circle in MATLAB can also be achieved using the plot function to approximate a circle by plotting a set of points along its circumference.
Below is the guide to plot a circle using the plot() function in Matlab.
Define Circle Parameters
To begin, you’ll need to define the parameters of the circle you want to plot:
centerXandcenterY: The x and y coordinates of the circle’s center.radius: The radius of the circle.
Here’s an example of how you can define these parameters:
% Define the circle parameters
centerX = 0;
centerY = 0;
radius = 5;
Calculate Circle Points
Next, you need to calculate the x and y coordinates of the points that lie on the circle’s circumference using trigonometric functions.
% Calculate x and y coordinates of circle points
theta = linspace(0, 2 * pi, 100); % Create 100 points around the circle
x = centerX + radius * cos(theta);
y = centerY + radius * sin(theta);
Create a Figure and Plot the Circle
Now that you have calculated the circle’s points, you can create a MATLAB figure and use the plot function to visualize the circle:
% Create a figure
figure;

% Plot the circle using the plot function
plot(x, y);

% Set aspect ratio to ensure the circle appears circular
axis equal;
Customize the Plot (Optional)
You can further customize the appearance of the plot as needed. For example, you can add a title, labels, grid lines, or change the color and line style of the circle.
% Add a title and axis labels
title('Plot of a Circle');
xlabel('X-Axis');
ylabel('Y-Axis');

% Add a grid
grid on;

% Change the color and line style of the circle
plot(x, y, 'r--'); % Red dashed line
Display the Plot
To view the plot of the circle, simply run your MATLAB script. The circle will be displayed in a separate figure window.
Example MATLAB Code
Here’s the complete MATLAB code that plots a circle and customizes the plot:
% Define the circle parameters
centerX = 0;
centerY = 0;
radius = 5;

% Calculate x and y coordinates of circle points
theta = linspace(0, 2 * pi, 100); % Create 100 points around the circle
x = centerX + radius * cos(theta);
y = centerY + radius * sin(theta);

% Create a figure
figure;

% Plot the circle using the plot function
plot(x, y);

% Set aspect ratio to ensure the circle appears circular
axis equal;

% Add a title and axis labels
title('Plot of a Circle');
xlabel('X-Axis');
ylabel('Y-Axis');

% Add a grid
grid on;

% Change the color and line style of the circle
plot(x, y, 'r--'); % Red dashed line
Running this code in MATLAB will generate a plot of a circle with the specified parameters.
Plotting a Circle Using the viscircles() Function in MATLAB
The viscircles function is a handy tool in MATLAB’s vast array of plotting functions. It is specifically designed for plotting circles and is part of the Image Processing Toolbox. With viscircles, you can effortlessly create circular shapes within your MATLAB plots.
Key Features of viscircles:
- Simplicity: The function simplifies the process of plotting circles by requiring only two main inputs: the center coordinates and radii of the circles you want to plot.
- Customization:
viscirclesallows you to customize the appearance of circles by changing their color, line style, and more. - Multiple Circles: You can plot multiple circles in a single plot by providing arrays of center coordinates and radii.
- Integration: It seamlessly integrates with other MATLAB plotting functions, enabling you to create complex visualizations that incorporate circles.
Now, let’s dive into the step-by-step process of using the viscircles function to plot a circle in MATLAB.
Use viscircles to Plot a Circle
Using viscircles to plot a circle in MATLAB is a straightforward process that involves a few simple steps. Here’s a quick overview of the steps we’ll follow:
- Define the circle’s parameters, including its center coordinates and radius.
- Create a MATLAB figure where you will display the circle.
- Utilize the
viscirclesfunction to plot the circle, providing the center coordinates and radius as inputs. - Customize the plot as needed by adding titles, labels, grid lines, and altering the appearance of the circle.
- Display the plot in a MATLAB figure window.
In the following sections, we will delve into each of these steps in detail, providing examples and code snippets to illustrate the process.
Step 1: Define Circle Parameters
Before plotting a circle, you need to define its characteristics, such as the coordinates of its center and its radius. These parameters will determine the circle’s position and size within your plot. Here’s how you can define these parameters in MATLAB:
% Define the circle parameters
centerX = 0;
centerY = 0;
radius = 5;
In the above code, centerX and centerY represent the x and y coordinates of the circle’s center, respectively, while radius specifies the circle’s radius.
Step 2: Create a Figure
To visualize the circle, you’ll need to create a MATLAB figure where it will be displayed. You can create a new figure using the figure function:
% Create a figure
figure;
This line of code initializes a new MATLAB figure window, which will serve as the canvas for your circle plot.
Step 3: Use viscircles to Plot the Circle
Now that you have defined the circle’s parameters and created a figure, you can proceed to plot the circle using the viscircles function. Here’s how to do it:
% Plot the circle using viscircles
viscircles([centerX, centerY], radius);
In the code above, viscircles is called with two main inputs:
[centerX, centerY]: A 1x2 array containing the x and y coordinates of the circle’s center.radius: The radius of the circle.
By providing these inputs, you instruct MATLAB to plot a circle with the specified center and radius within the current figure.
Step 4: Customize the Plot (Optional)
Customization allows you to enhance the appearance of your plot. While this step is optional, it can be beneficial for creating informative and visually appealing visualizations. Here are some customization options you can explore:
Change Circle Properties
You can customize the properties of the plotted circle, such as its color and line style, by specifying additional parameters when calling viscircles. For example:
% Plot a red dashed circle
viscircles([centerX, centerY], radius, 'EdgeColor', 'r', 'LineStyle', '--');
In this code, we set the circle’s edge color to red and use a dashed line style. You can experiment with other properties, such as 'FaceColor', to change the circle’s fill color.
Add Titles and Labels
To provide context to your plot, consider adding titles and labels using the title, xlabel, and ylabel functions. For example:
% Add a title and labels
title('Circle Plot Example');
xlabel('X-Axis');
ylabel('Y-Axis');
These commands add a title to the plot and label the x and y axes.
Customize Axes and Grid
You can customize the appearance of the plot’s axes and grid lines using functions like axis and grid. For instance:
% Customize axes and grid
axis([-10, 10, -10, 10]);  % Set axis limits
grid on;                   % Display grid lines
Here, we set the axis limits to control the visible range and enable grid lines.
Step 5: Display the Plot
After defining the circle, customizing the plot (if desired), and adding necessary elements, you can display the final plot by executing the figure command:
% Display the plot
figure;
This command opens a new figure window displaying your circle plot along with any customizations you’ve applied.
The complete working code is below.
% Define the circle parameters
centerX = 0;
centerY = 0;
radius = 5;

% Create a figure
figure;

% Plot the circle using viscircles
viscircles([centerX, centerY], radius);

% Customize the plot (optional)
title('Circle Plot Example');
xlabel('X-Axis');
ylabel('Y-Axis');
axis([-10, 10, -10, 10]);  % Set axis limits
grid on;                   % Display grid lines
Conclusion
In MATLAB, the ability to plot circles is essential for a wide range of applications. In this article, we’ve explored three different methods to plot circles using the rectangle(), plot(), and viscircles() functions. Each method offers unique advantages and flexibility, allowing you to create circle plots tailored to your specific requirements.
The rectangle() function provides a simple way to draw circles within a rectangular coordinate system. It’s ideal for basic circle plots and when you need to specify circles by their center and dimensions.
The plot() function, with a bit of trigonometry, enables you to draw circles with precise control over their position and size. This method is useful when you want to create customized circle plots and need to define the circle’s points explicitly.
For more advanced circle plotting and the ability to visualize multiple circles efficiently, the viscircles() function is an excellent choice. It simplifies the process of plotting circles, making it suitable for various applications, including image processing, data visualization, and geometric modeling.
