How to Label Lines in MATLAB
- Understanding the Basics of Labeling in MATLAB
- Adding Multiple Labels for Clarity
- Customizing Labels for Aesthetic Appeal
- Conclusion
- FAQ

Labeling lines in MATLAB plots is an essential skill for anyone looking to enhance their data visualization capabilities. Whether you’re presenting your findings in a report or just trying to make sense of your data, clear labeling can make a significant difference. The text() function in MATLAB allows you to place text annotations anywhere in your plot, making it easier to identify specific lines, points, or areas of interest. This guide will walk you through the process of labeling lines effectively, ensuring your plots are not only informative but also visually appealing.
Understanding the Basics of Labeling in MATLAB
Before diving into the specifics, it’s important to grasp the basic components of MATLAB’s plotting functions. When you create a plot, you typically use functions like plot(), scatter(), or bar(). These functions generate visual representations of your data. However, to make your plots more informative, you can use the text() function to add labels directly onto your lines.
The text() function requires you to specify the x and y coordinates where you want the text to appear, along with the string you want to display. This flexibility allows you to position labels precisely where they are most relevant.
Here’s a simple example of how to label a line in a MATLAB plot:
t = 1:0.01:2;
plot(cos(2*pi*t))
t = text(90,0.8,'\leftarrowCosine','FontSize',16,'Color','b')
Output:

You can give your desired color to the label by defining it after the label using the Color property. You can also add multiple labels at multiple positions on the plot with different names, line styles, colors, and sizes. For example, let’s add one more plot and label on the above graph with sine name of green color, a right arrow, and 16 font size. See the code below.
Adding Multiple Labels for Clarity
When working with more complex data, you may need to label multiple lines or points in your plot. MATLAB makes this easy with the text() function, allowing you to add as many labels as necessary.
Consider a scenario where you have multiple lines representing different mathematical functions. You can label each line to clarify what each one represents. Here’s how you can do it:
t = 1:0.01:2;
plot(cos(2*pi*t))
t1 = text(90,0.8,'\leftarrowCosine','FontSize',16,'Color','b')
hold on
plot(sin(2*pi*t),'Color','g')
t2 = text(22,0.6,'Sine\rightarrow','FontSize',16,'Color','g')
Output:
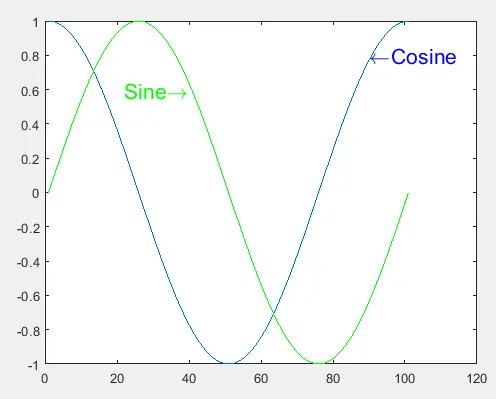
This MATLAB code plots a cosine and sine wave on the same graph. It creates a time vector, then plots cos(2*pi*t) in blue and sin(2*pi*t) in green. Text annotations with arrows are added to label each wave, with adjusted font size and color to match the respective plots. hold on ensures both plots appear on the same figure.
By using different colors for each label, you enhance the visual clarity of your plot. This method is particularly useful in presentations or reports where you need to convey complex information quickly and effectively.
Check this link for more information about the text() function.
Customizing Labels for Aesthetic Appeal
While functionality is important, the aesthetic appeal of your labels can greatly enhance the overall presentation of your plots. MATLAB offers various options for customizing your text labels, such as changing the font style, size, and color.
You can also use different text properties to make your labels more visually appealing. For instance, you can italicize or bold your text. Here’s an example of how to apply these customizations:
x = 0:0.1:10;
y = exp(-0.1*x) .* sin(2*pi*x);
plot(x, y);
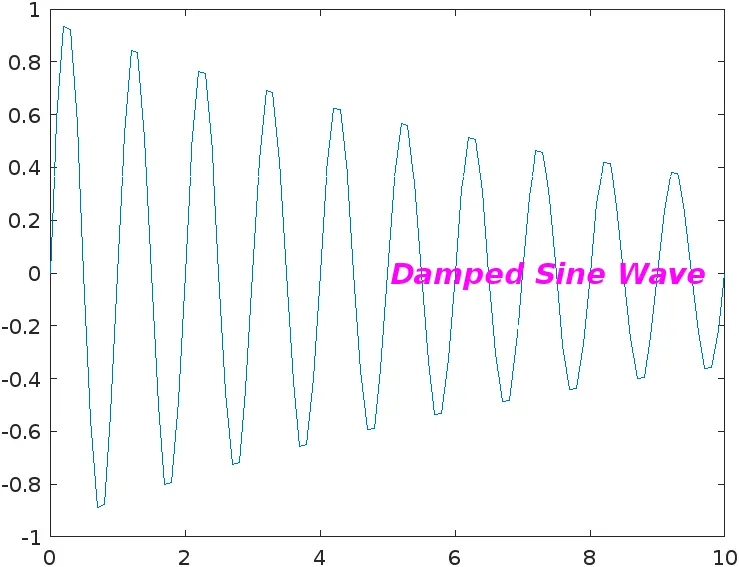
text(5, exp(-0.5) * sin(10*pi), 'Damped Sine Wave', ...
'FontSize', 14, 'FontWeight', 'bold', 'FontAngle', 'italic', ...
'Color', 'magenta');
In this code, we plot a damped sine wave. The label is customized to be bold and italicized, making it stand out more effectively against the plot background.
Output:
Customizing your labels not only enhances readability but also adds a professional touch to your visualizations. Remember, the goal is to make your plots as informative and engaging as possible.
Conclusion
Labeling lines in MATLAB is a straightforward yet powerful technique that can significantly improve the clarity and professionalism of your plots. By using the text() function, you can easily add informative labels that enhance your audience’s understanding of the data being presented. Whether you’re working with simple plots or complex data visualizations, mastering this skill will undoubtedly elevate your MATLAB experience. So go ahead, experiment with different labels, styles, and placements to find what works best for your specific needs.
FAQ
-
How do I position labels in MATLAB?
You can position labels using thetext()function by specifying the x and y coordinates where you want the label to appear. -
Can I change the font size of the labels?
Yes, you can change the font size of the labels by using the ‘FontSize’ property in thetext()function.
-
Is it possible to add multiple labels to a single plot?
Absolutely! You can call thetext()function multiple times to add as many labels as you need. -
How can I customize the color of the labels?
You can customize the color of the labels by using the ‘Color’ property in thetext()function. -
What is the best way to label complex plots?
For complex plots, use different colors and styles for each label, and ensure they are positioned clearly to avoid overlap.
