How to Plot Bode Diagram in MATLAB
- Understanding the Bode Diagram
- Setting Up MATLAB for Bode Plotting
- Customizing the Bode Plot
- Analyzing the Bode Diagram
- Conclusion
- FAQ

Creating a Bode diagram is a fundamental skill in control systems and signal processing. It allows engineers and scientists to analyze the frequency response of systems, providing insights into stability and performance. In MATLAB, plotting a Bode diagram is straightforward with the bode() function. This powerful tool enables users to visualize gain and phase across a range of frequencies, making it essential for system analysis. Whether you’re a student or a professional, understanding how to plot Bode diagrams in MATLAB can significantly enhance your ability to design and evaluate control systems.
In this article, we will explore the steps to create Bode diagrams using MATLAB, ensuring you grasp both the theory and practical application.
Understanding the Bode Diagram
Before diving into MATLAB, it’s crucial to understand what a Bode diagram represents. A Bode plot consists of two graphs: one for magnitude (gain) and another for phase, both plotted against frequency on a logarithmic scale. The magnitude plot shows how the output amplitude of a system varies with frequency, while the phase plot indicates how the output phase shifts relative to the input. By visualizing these characteristics, engineers can assess system behavior and make informed design decisions.
Setting Up MATLAB for Bode Plotting
To get started with plotting Bode diagrams in MATLAB, you need to ensure that you have the necessary toolboxes installed. The Control System Toolbox is essential for using the bode() function. If you don’t have it, you can check for installation and obtain it through MATLAB’s Add-On Explorer.
Once you have the toolbox ready, you can begin defining your system. You can represent systems using transfer functions, state-space models, or zero-pole-gain (ZPK) formats. Here’s a simple example of how to define a transfer function and plot its Bode diagram.
sys = tf([1 2 0.5],[9 1 0]);
bode(sys)
Output:
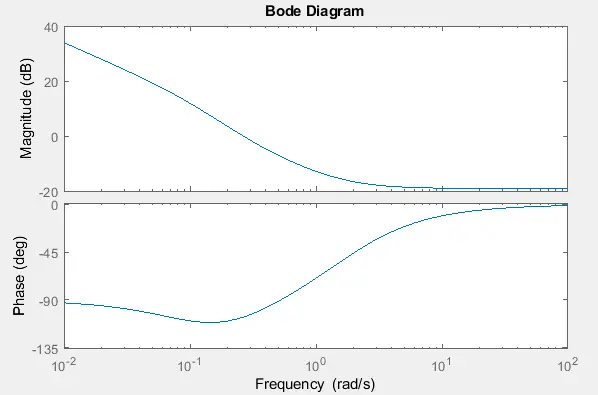
In the above code, we use the transfer function coefficients and the tf() function to define the dynamic function. The first argument of the tf() function is the vector containing the coefficients of the numerator, and the second argument is the vector containing the coefficients of the denominator, and the sequence is from higher to lower power. If power is missing, then 0 will be used as its coefficient.
Customizing the Bode Plot
MATLAB provides flexibility in customizing your Bode plots to suit your needs. You can adjust the frequency range, change the plot style, and add titles or labels for clarity. For instance, if you want to plot the Bode diagram over a specific frequency range, you can specify the frequency vector as follows:
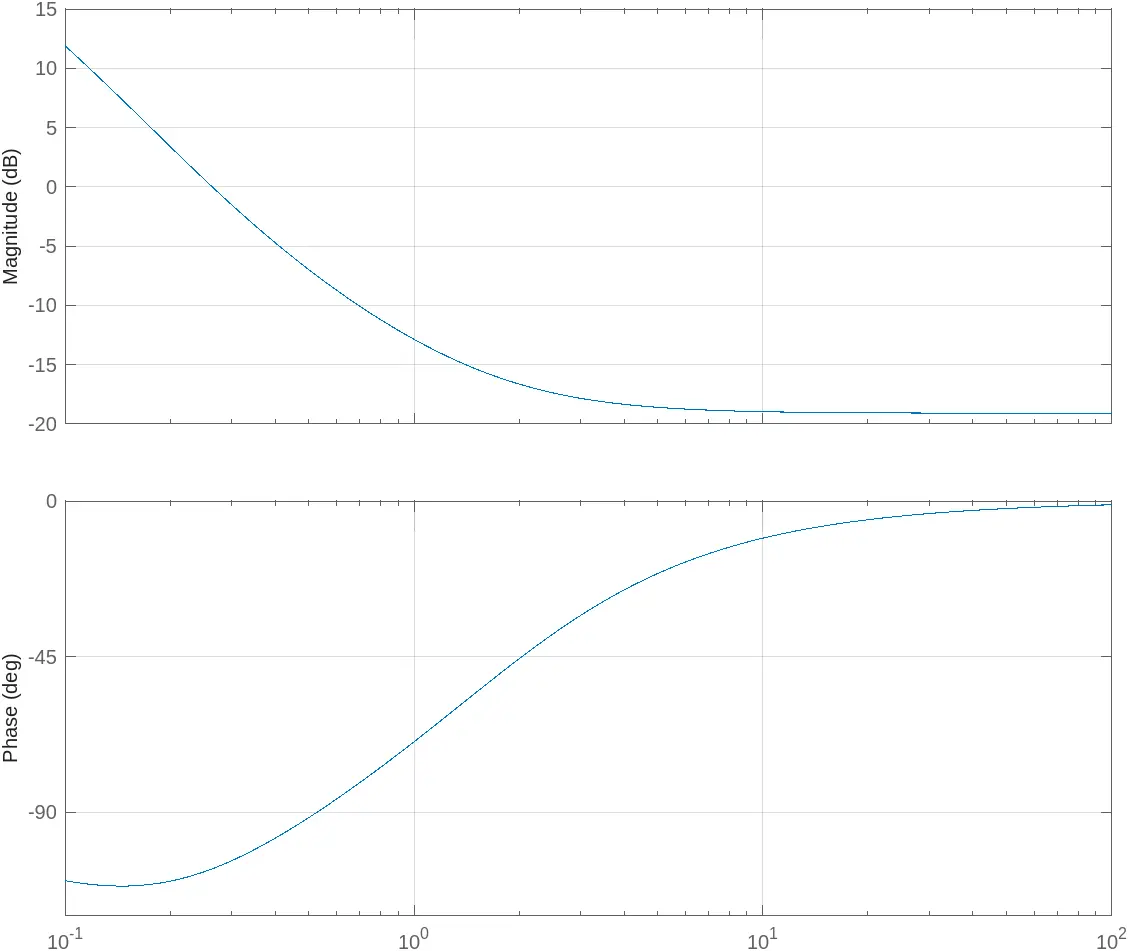
w = logspace(-1, 2, 100);
bode(sys, w);
grid on;
title('Customized Bode Plot');
Here, logspace(-1, 2, 100) generates a logarithmic spaced vector from 0.1 to 100 rad/s, which is passed to the bode() function. The title() function adds a descriptive title to your plot.
Output:
Customizing your Bode plot not only enhances its visual appeal but also makes it more informative. By tailoring the frequency range and adding titles, you can ensure that your audience clearly understands the implications of the plot.
Analyzing the Bode Diagram
Once you have generated the Bode plot, the next step is to analyze the results. The gain plot informs you about the amplification or attenuation of the system at various frequencies, while the phase plot reveals the delay introduced by the system.
For example, if the gain is significantly high at certain frequencies, it might indicate potential instability. Conversely, if the phase shift approaches -180 degrees while the gain is greater than 0 dB, it could signal a risk of oscillations. By carefully examining these characteristics, you can make informed decisions about system modifications or tuning.
To extract numerical data from your Bode plot, you can use the bode command with output arguments:
[mag, phase, wout] = bode(sys);
This command retrieves the magnitude (mag), phase (phase), and frequency vector (wout) used in the plot. You can then analyze these values further or export them for reporting.
Analyzing the Bode diagram provides critical insights into system behavior, allowing you to optimize performance and ensure stability.
Conclusion
Plotting a Bode diagram in MATLAB is a straightforward yet powerful technique for analyzing the frequency response of systems. By leveraging the bode() function, you can easily visualize gain and phase characteristics, customize your plots, and analyze results to make informed engineering decisions. Whether you’re working on control systems, signal processing, or any field requiring frequency analysis, mastering Bode plots will undoubtedly elevate your understanding and capabilities.
As you continue to explore MATLAB and its functionalities, remember that practice is key. The more you experiment with different systems and configurations, the more proficient you’ll become in interpreting Bode diagrams and applying these insights to real-world problems.
FAQ
-
What is a Bode diagram?
A Bode diagram is a graphical representation of a system’s frequency response, showing magnitude and phase plots. -
How do I install the Control System Toolbox in MATLAB?
You can install the Control System Toolbox through MATLAB’s Add-On Explorer by searching for it and following the installation prompts. -
Can I customize the Bode plot in MATLAB?
Yes, MATLAB allows you to customize Bode plots by adjusting frequency ranges, adding titles, and modifying plot styles. -
What does the magnitude plot indicate?
The magnitude plot shows how the output amplitude of a system varies with frequency, indicating amplification or attenuation. -
How can I extract data from a Bode plot in MATLAB?
You can extract data using thebode()command with output arguments to retrieve magnitude, phase, and frequency values.
