How to Plot Histogram in MATLAB
- Create Histogram of Vectors in MATLAB
- Create Categorical Histogram in MATLAB
- Create Normalized Histogram in MATLAB
- Plot Multiple Histograms on the Same Figure in MATLAB
- Save a Histogram in MATLAB
- Bivariate Histogram in MATLAB
In this tutorial, we will discuss how to plot a histogram of given data using the histogram() and histogram2() function in MATLAB.
Create Histogram of Vectors in MATLAB
To create a histogram of the given vector, you can use the histogram() function in MATLAB. For example, let’s create a histogram of a given vector. See the code below.
vector = randn(100,1);
HG = histogram(vector)
Output:
HG =

  Histogram with properties:

             Data: [100x1 double]
           Values: [2 18 29 31 17 3]
          NumBins: 6
         BinEdges: [-3 -2 -1 0 1 2 3]
         BinWidth: 1
        BinLimits: [-3 3]
    Normalization: 'count'
        FaceColor: 'auto'
        EdgeColor: [0 0 0]
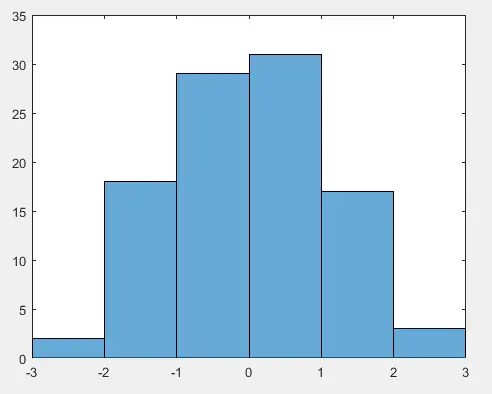
In the above code, we created the histogram of a random vector. In the output, the properties of the histogram, and we can change these properties. For example, let’s change the face color of the histogram using the FaceColor property, the edge color using the EdgeColor property and, the number of bins using the NumBins property. See the code below.
vector = randn(100,1);
HG = histogram(vector);
HG.FaceColor = 'g';
HG.EdgeColor = 'r';
HG.NumBins = 10;
Output:
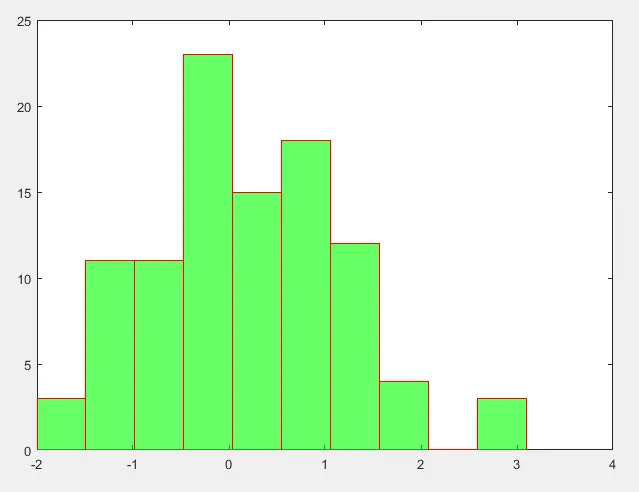
The face color of the histogram is changed to green, the edge color changed to red, and the number of bins is changed to 10. You can also change other histogram properties as you like.
Create Categorical Histogram in MATLAB
You can also create a categorical histogram using the histogram() function. You can define values in the categorical array like some names etc., and you have to give each categorical variable a value that will be shown as height in the histogram. For example, let’s create a histogram of three categorical variables: Yes, No, and Not Sure. See the code below.
Vector = [7 7 7 8 8 8 8 9 7 8 8 8 7 8 7 8 7 8 8 8];
Cat = categorical(Vector,[7 8 9],{'Yes','No','Not Sure'});
HG = histogram(Cat)
Output:
In the above code, we created a categorical histogram of three variables. We have assigned each variable a different value. For example, we assigned the value 7 to the variable Yes, 8 to the variable No, and 9 to the variable Not Sure. The value 7 repeated seven times in the variable Vector means the variable Yes will be shown in a histogram with height 7 and so on. You can add as many categorical variables as you like in the histogram.
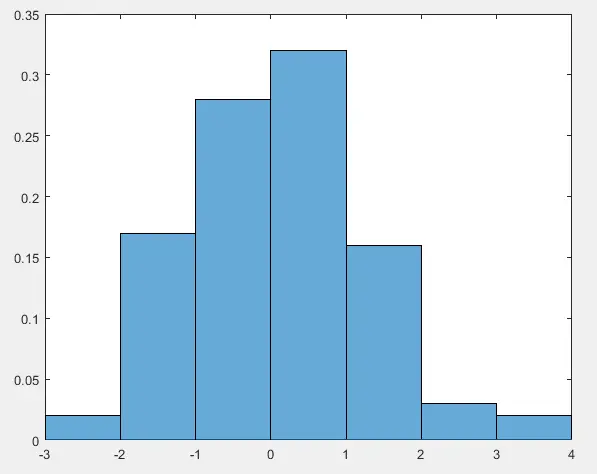
Create Normalized Histogram in MATLAB
We can normalize a histogram using the Normalization property inside the histogram() function. For example, let’s create a histogram from random numbers and then normalize it using the Normalization property. See the code below.
clc
vector = randn(100,1);
HG = histogram(vector,'Normalization','probability')
Output:

The above histogram is normalized using probability normalization. You can use other normalizations as well, like count normalization.
Plot Multiple Histograms on the Same Figure in MATLAB
We can also plot multiple histograms on the same figure using the hold function. For example, let’s plot two histograms on the same figure. See the code below.
vector = randn(100,1);
HG1 = histogram(vector)
hold on
vector = 5+randn(100,1);
HG2 = histogram(vector)
Output:
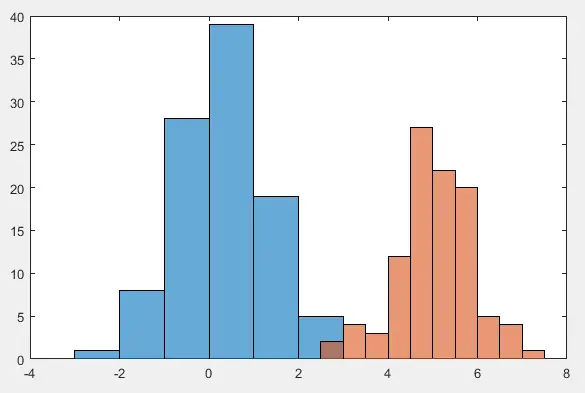
In the above code, we plotted two histograms on the same figure. You can plot as many plots as you like on the same figure, and MATLAB will give them a separate color automatically. You can also give each histogram your desired color. You can also add legends to the histograms using the legend() function to separate them from one another.
Save a Histogram in MATLAB
You can save a histogram using the savefig() function in MATLAB, and you can load the saved histogram using the openfig() function. See the code below.
savefig('Hist.fig');
close gcf
histogram = openfig('Hist.fig');
In the above code, Hist is the variable where the histogram is stored. Check this link for more information.
Bivariate Histogram in MATLAB
If you want to create a histogram of two variables, you can use the histogram2() function. For example, let’s plot a histogram of two vectors. See the code below.
vector1 = randn(100,1);
vector2 = randn(100,1);
HG = histogram2(vector1,vector2)
Output:
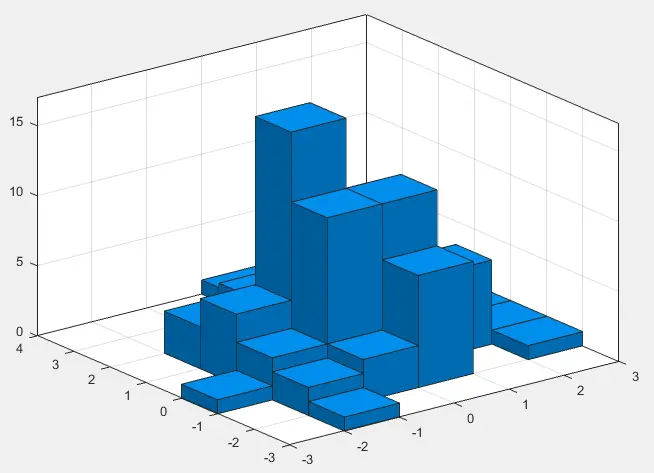
In the above code, we plotted a bivariate histogram from two vectors. You can also add a color bar using the colorbar function, which will add colors to the histogram according to the height of the bins. The color of the bins will change from colder to hotter with an increase in the bin’s height and vise versa. For example, let’s add a color bar to the above bivariate histogram. See the code below.
vector1 = randn(100,1);
vector2 = randn(100,1);
HG = histogram2(vector1,vector2,[12 12],'FaceColor','flat')
colorbar
Output:

You can also change the view of the histogram using the view() function. For example, let’s change the view of the above bivariate histogram from 3D to 2D. See the code below.
vector1 = randn(100,1);
vector2 = randn(100,1);
HG = histogram2(vector1,vector2,[12 12],'FaceColor','flat')
colorbar
view(2)
Output:
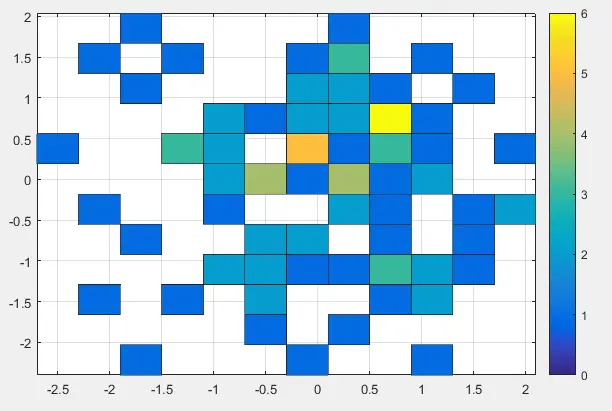
You can also change other properties of the bivariate histogram using the same function and properties as used in the above histograms. For example, you can change the face color using the FaceColor property, edge color using the EdgeColor property, number of bins using the NumBins property, and normalization using the Normalization property, etc. You can also save and load the bivariate histograms using the savefig() and openfig() functions. Check this link for more information.
