How to Change Legend Title in MATLAB

This tutorial will discuss changing the title of a legend using the title() function in Matlab.
Change Title of Legend Using the title() Function in MATLAB
In Matlab, we can add legends to a plot using the legend() function. There is no title on the legends by default, but we can add it using the title() function in Matlab. We have to create a legend object using the legend() function and use this object inside the title() function to set the title of the legend. For example, let’s add a title to a legend on a plot using the title() function. See the code below.
x = 10:0.1:20;
y = sin(x);
plot(x,y)
leg = legend('legend 1');
title(leg,'my title')
Output:
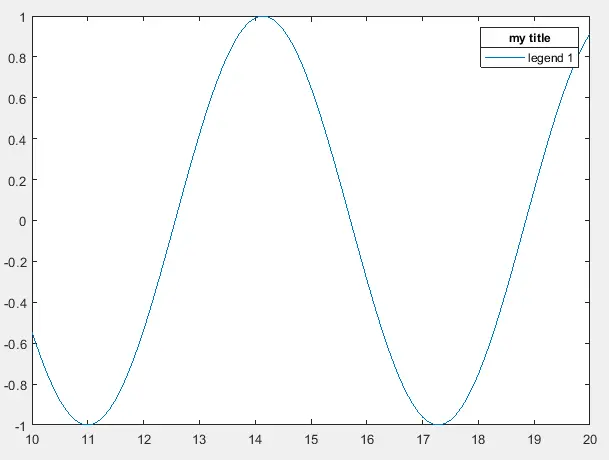
There is a title over the legend in the plot, which you can change using the title() function. If we take two outputs from the legend() function, the title disappears from the plot instead of one output. For example, let’s add a second output in the legend() function and see what happens to the title of the legend. See the code below.
x = 10:0.1:20;
y = sin(x);
plot(x,y)
[leg,att] = legend('legend 1');
title(leg,'My Title')
Output:
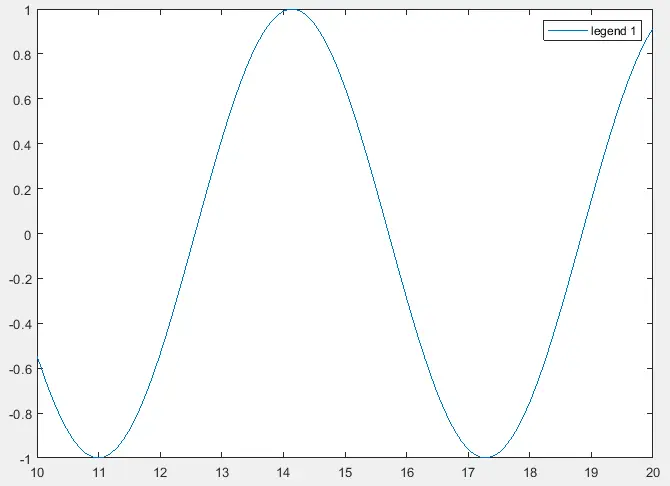
In the output, the title is not visible on the plot because of the second output. To solve this problem, we have to set the Visible property of the title to make the title visible on the plot. After setting the title’s visibility, it will be visible on the plot, but it won’t be above the legends. To solve this problem, we have to set the position of the title using the Position property. To make the title more visible, we can set the location of the legend using the Location property. For example, let’s fix the title in the above figure. See the code below.
x = 10:0.1:20;
y = sin(x);
plot(x,y)
[leg,att] = legend('legend 1');
title(leg,'My Title')
leg.Title.Visible = 'on';
leg.Title.NodeChildren.Position = [0.5 1.6 0];
leg.Location = 'east';
Output:
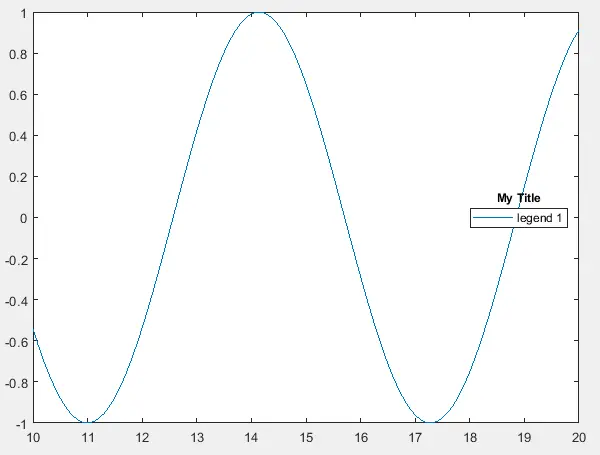
In the output, the title is again visible on the plot. You can also set other title properties like the color and font size using the Color and FontSize properties. We can also use the text() function to add a title to the legend. You need to pass the x and y coordinate along with the string you want to place the text. You can select the coordinates from the plot, and then use the text() function to place the text on the selected coordinates. You won’t see the text if you give the coordinates that don’t lie on the plot. You can also change the FontSize property and the color using the Color property etc. For example, let’s put the title over the legend with font size 16 and green color. See the code below.
x = 10:0.1:20;
y = sin(x);
plot(x,y)
legend('legend 1','Location','east');
text(17.5,0.2,'My Title','FontSize',16,'Color','green')
Output:
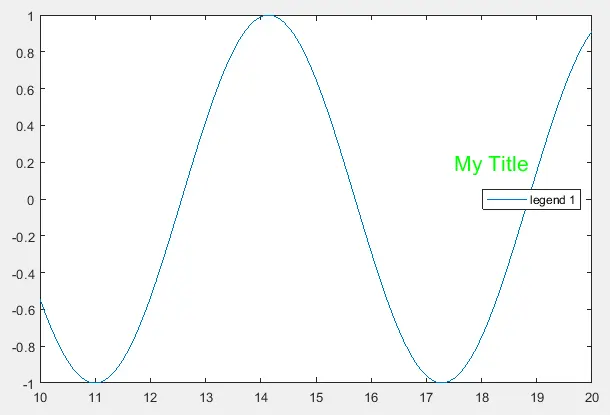
In the output, the title is placed over the legend using the x and y coordinates. The first two arguments inside the text() function are the x and y coordinates used to set the position of the string on the plot.
